The Kubernetes dashboard picture got messy over the last couple of years. The old built-in Dashboard was archived in January 2026, and the project’s own blog now points people at Headlamp. Lens, the tool most of us reached for next, moved behind a paid account after Mirantis took it over, which is why the OpenLens and FreeLens forks exist at all. So when a new open source option shows up, it is worth a real look rather than another skim.
Radar is that option: an open source Kubernetes UI you run against your own kubeconfig. It is an Apache-2.0 project from Skyhook, a single Go binary of about 30 MB that gives you a topology map, an event timeline, Helm and GitOps management, a cluster audit, live network traffic, and (the part that made me sit up) a built-in MCP server so an AI agent like Claude Code can query the cluster for you. No agent to install in the cluster for local use, and nothing gets shipped off to a vendor.
I wanted to know whether it holds up outside a demo, so I stood up a real cluster, seeded it with workloads, and drove every feature. This guide is the result: install, each view with a screenshot from that cluster, the eBPF traffic setup and the one kernel gotcha to know about, the MCP wiring, and an honest read on where Radar fits next to Lens, Headlamp, and k9s.
I ran everything here on a three-node kubeadm cluster (Ubuntu 24.04, Kubernetes 1.36) in July 2026, with Radar reading a normal kubeconfig. Every screenshot is from that cluster, not a canned demo.
What Radar actually is
Radar runs in one of two ways, and the distinction matters for how you think about it.
Local mode is the default and the one most people will use. You run the binary next to your kubeconfig, exactly like kubectl or k9s, and it serves a web UI on a local port. Nothing is deployed into the cluster, no data leaves your machine, and it works fine against an air-gapped or restricted cluster because it only uses the permissions your kubeconfig already has.
In-cluster mode is a Helm install that runs Radar as a Deployment for a whole team to share behind an ingress. Same UI, different deployment target. I cover it near the end.
Because it leans on your kubeconfig, Radar sees exactly what you are allowed to see. Point it at a context and it renders that cluster. The features below are all available in the free, open source build.
The cluster I tested Radar on
Radar needs a cluster and a kubeconfig, nothing more. You do not need to size anything for Radar itself in local mode because the binary runs on your workstation, not the cluster. What actually matters is that the cluster has enough running in it that the views are not empty, so the real driver of the lab spec is the workloads you seed, not Radar.
For reference, here is what I used. Treat these as a floor for following along, not a production recommendation:
- Three nodes (one control plane, two workers), 2 vCPU and 4 GB RAM each, kubeadm-bootstrapped. My own bootstrap steps are in the home Kubernetes cluster guide; a single-node K3s works just as well for trying Radar.
- Calico as the CNI, and a small set of seeded workloads: a podinfo Helm release, a load generator driving traffic to it, and an Argo CD application so the GitOps view has something real to show.
Confirm the cluster is reachable before you start, because Radar will only ever be as healthy as your kubeconfig:
kubectl get nodesAll three nodes report Ready:
NAME     STATUS   ROLES           AGE   VERSION
k8s-cp   Ready    control-plane   2h    v1.36.2
k8s-w1   Ready    <none>          2h    v1.36.2
k8s-w2   Ready    <none>          2h    v1.36.2
With a healthy cluster to point at, Radar has something real to render. Installing it is a one-liner.
1. Install Radar and open the UI
The quickest install is the upstream script, which drops a single binary and registers a kubectl plugin:
curl -fsSL https://get.radarhq.io | shIf you would rather use a package manager, all of these land the same binary:
brew install skyhook-io/tap/radar        # macOS / Linuxbrew
kubectl krew install radar               # via the krew plugin index
scoop bucket add skyhook https://github.com/skyhook-io/scoop-bucket   # Windows
scoop install radar
There are also .deb and .rpm packages on the GitHub releases page and a PowerShell one-liner for Windows. Once it is on your PATH, start it as a kubectl plugin:
kubectl radarThat serves the UI on port 9280 and opens your browser. Running it on your laptop, the address is http://localhost:9280. I did something slightly different: I ran the binary on the control-plane node and let it bind to all interfaces, so anyone on my homelab LAN could open it without each of us running the plugin. Either way you get the same overview, and it is a good first screen to gauge whether Radar is reading the cluster correctly.
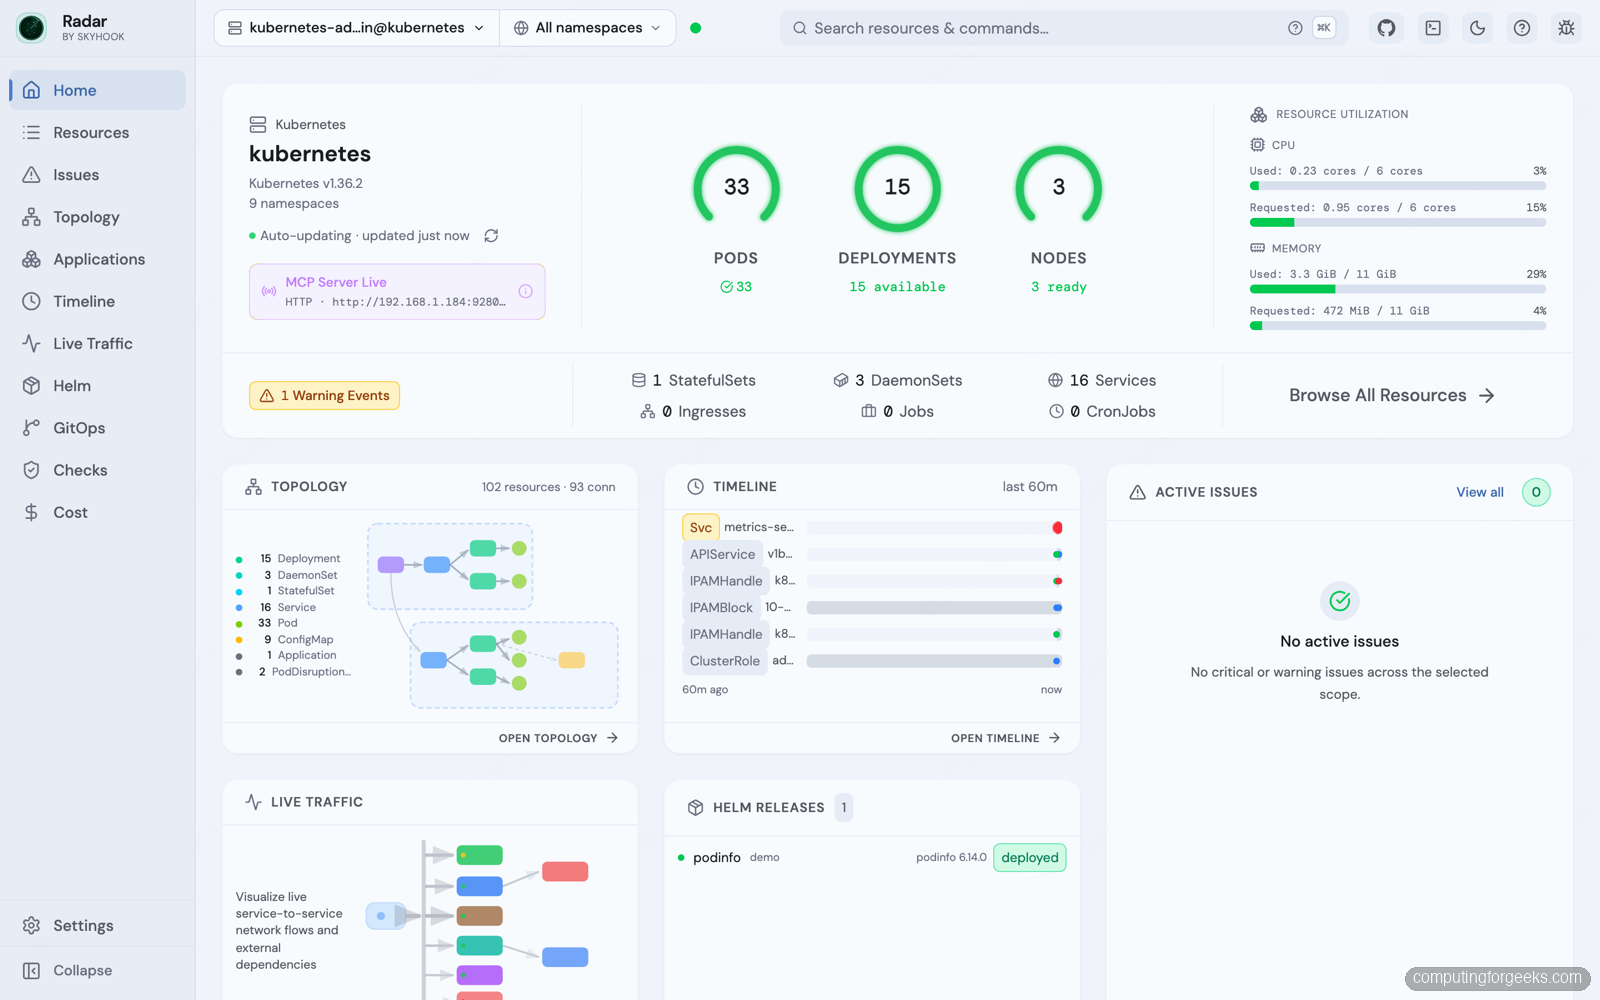
The overview counts pods, deployments and nodes, previews the topology and event timeline, lists Helm releases, and shows resource utilization. The utilization rings only fill in once metrics-server is present, which is worth installing anyway. There is also a purple “MCP Server Live” badge, which is Radar telling you its AI endpoint is already up. More on that later.
2. Map the cluster with the topology view
The topology view is where Radar earns its name. It builds a live graph of your resources and the relationships between them, laid out automatically and updated over a server-sent event stream, so pods appearing and disappearing animate in place. You can group by namespace, filter by kind from the left rail, and scope to a single namespace to cut the noise.
Scoped to my demo namespace, the relationships are obvious at a glance: the load generator deployment owns its pod, and the podinfo Service fronts the podinfo Deployment, which owns its two pods.
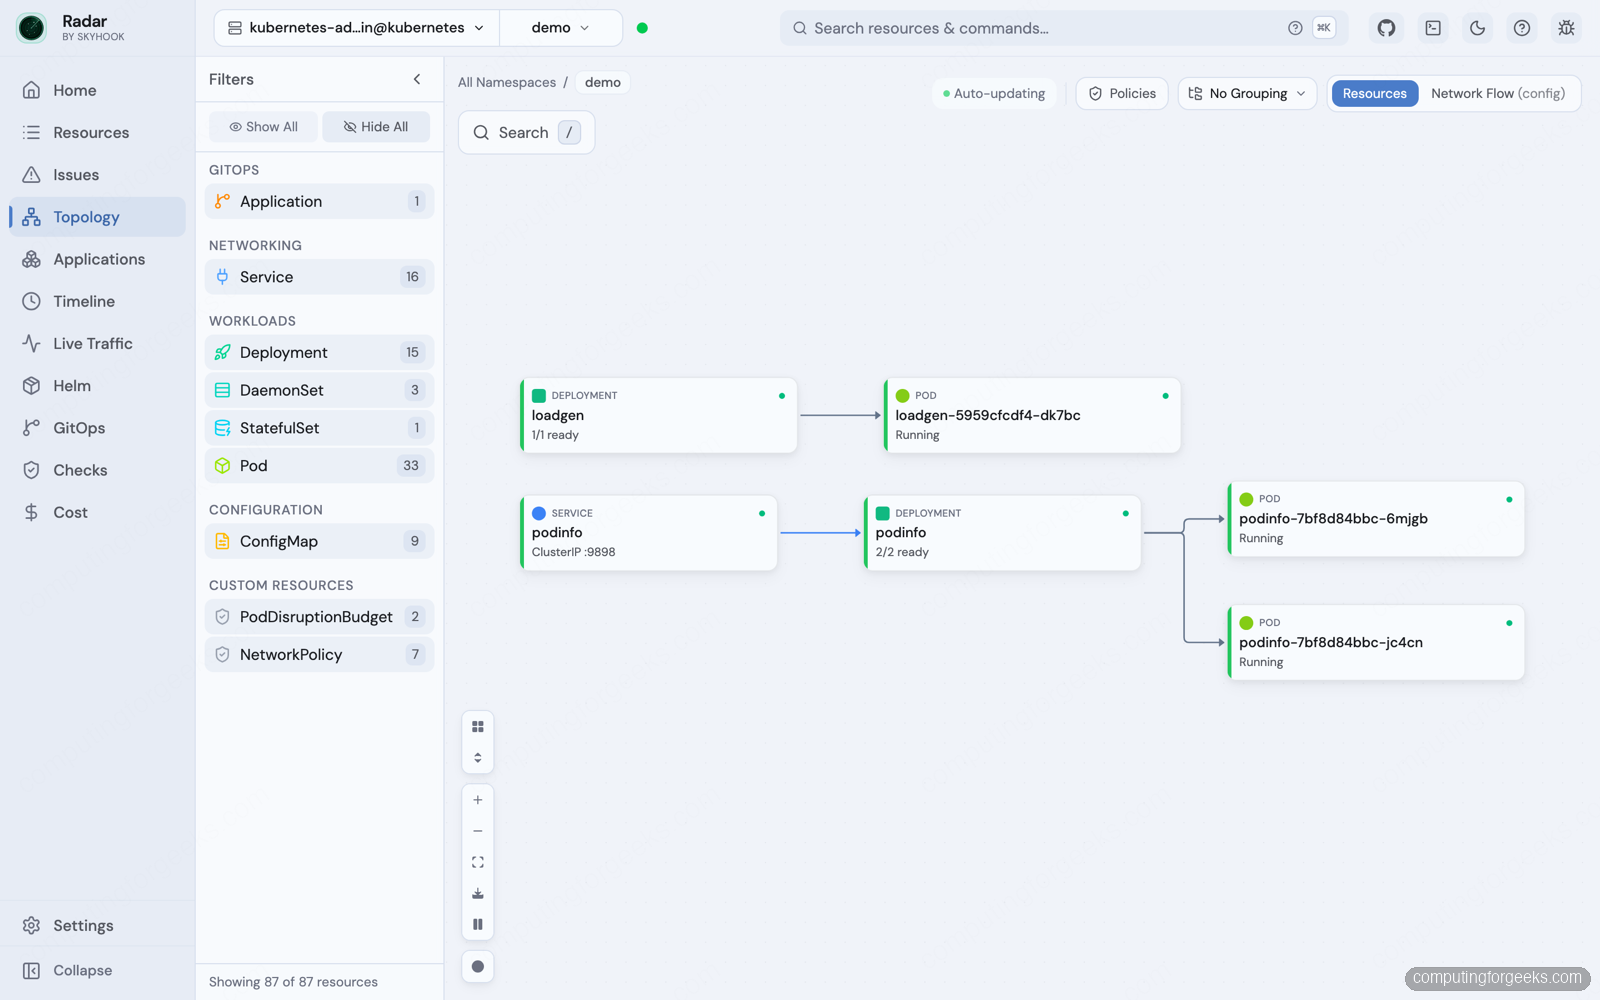
Click any node and Radar opens the resource detail without dropping you into raw YAML unless you ask for it. This is the view I keep open during a deploy, because “which pods does this Service actually select” stops being a kubectl describe hunt and becomes a line you can see.
3. Scroll back through changes with the timeline
Kubernetes throws away Events after about an hour by default, which is exactly the window you need after something breaks. Radar keeps its own timeline so you can scroll back past that TTL and see when resources were created, modified, or deleted, with the state changes colour-coded per resource.
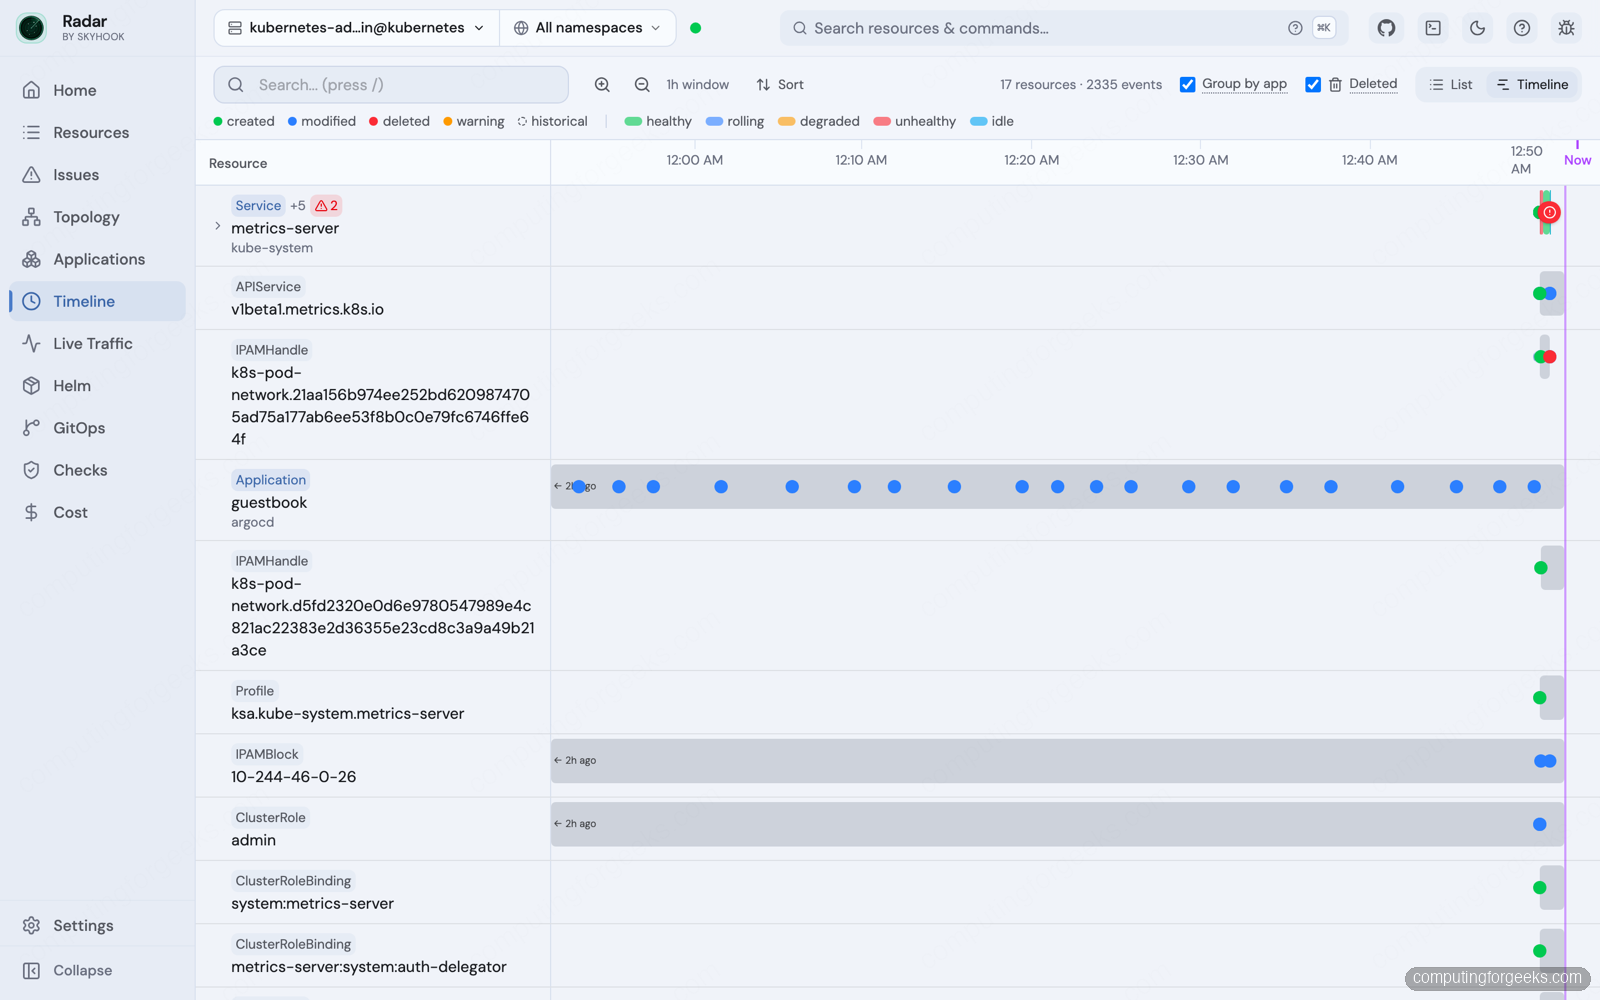
In the shot above you can actually see the metrics-server install I ran mid-session show up as fresh created and modified events, next to the Argo CD application’s own history. Grouping by app keeps it readable on a busy cluster. For a “this worked an hour ago, what changed” question, this is faster than reconstructing the story from logs.
4. Inspect and roll back Helm releases
Radar reads Helm release state straight from the cluster, so every release shows up with its chart, status, and revision. Open one and you get tabs for the rendered manifest, the values, the owned resources, and hooks. The tab I care about most is History.
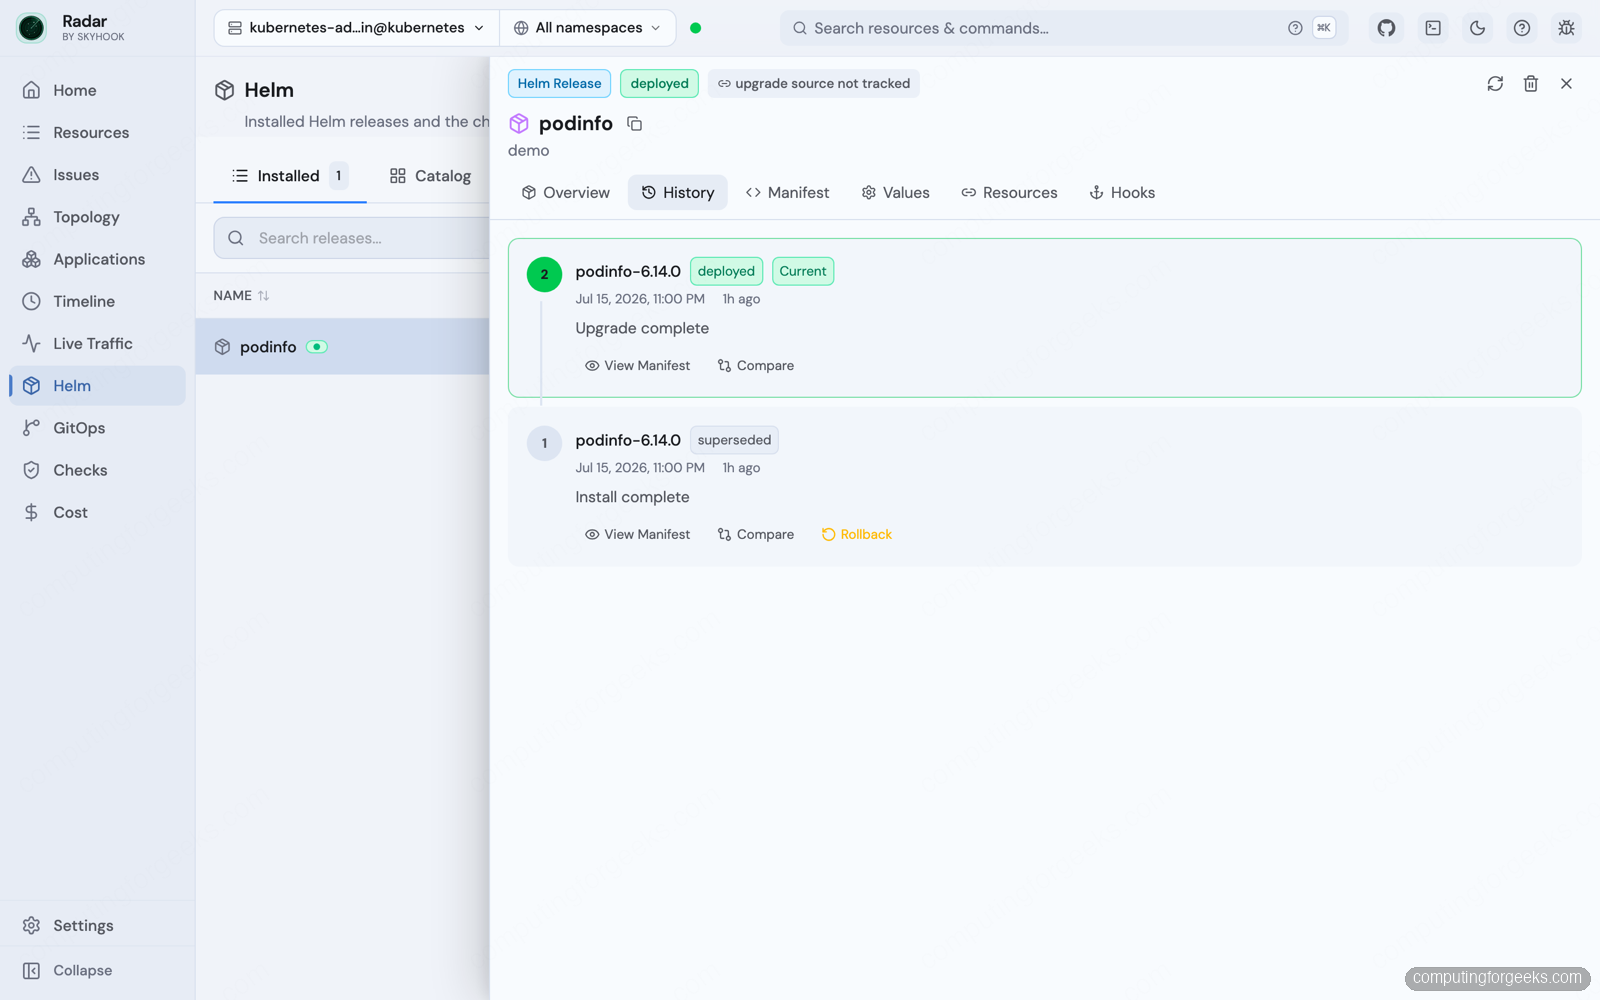
My podinfo release had two revisions because I upgraded it once. Radar marks revision 2 as the current deployed one and revision 1 as superseded, and each older revision carries a Rollback button and a Compare action that diffs it against the current release. Rolling back a bad upgrade becomes one click instead of remembering the helm rollback syntax and the revision number under pressure. The Compare diff is the part I did not expect and now want everywhere.
5. Watch GitOps sync from the UI
If you run Argo CD or Flux, Radar picks them up automatically and gives you a controller-aware view instead of treating their custom resources as anonymous blobs. Each application shows its sync status, health, source repository and path, and last sync time, and you can trigger a sync or reconcile from the UI.
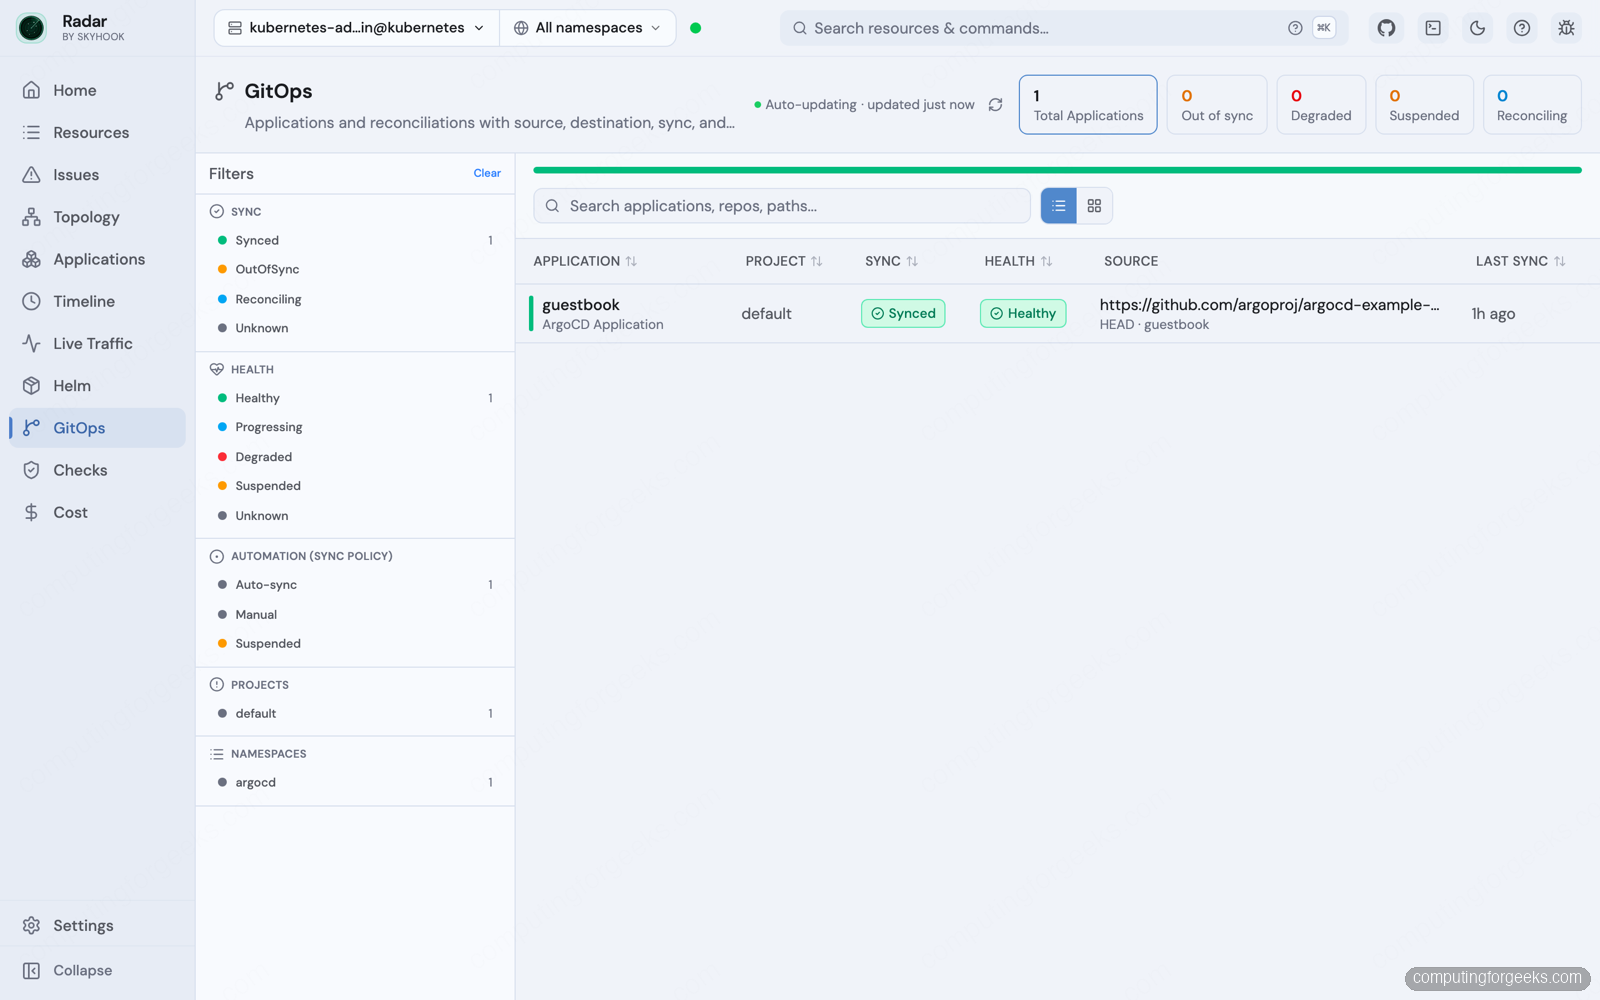
My guestbook application shows Synced and Healthy, pulling from its Git repo at the guestbook path. If you already lean on Argo CD, the Argo CD CLI and login flow still does the heavy lifting; Radar is the read-and-nudge surface that sits next to it rather than replacing it.
6. See real service traffic with eBPF
This is the feature I was most skeptical about, because service-to-service traffic maps are usually either a service mesh you did not want or a pile of manual instrumentation. Radar takes a lighter path: it reads flows from an eBPF collector. It supports caretta, Cilium Hubble, and Istio, and when you open the Live Traffic view on a cluster with none of them, Radar inspects the cluster and recommends one. On mine it detected a generic CNI and offered to install caretta with Helm, right from a built-in wizard.
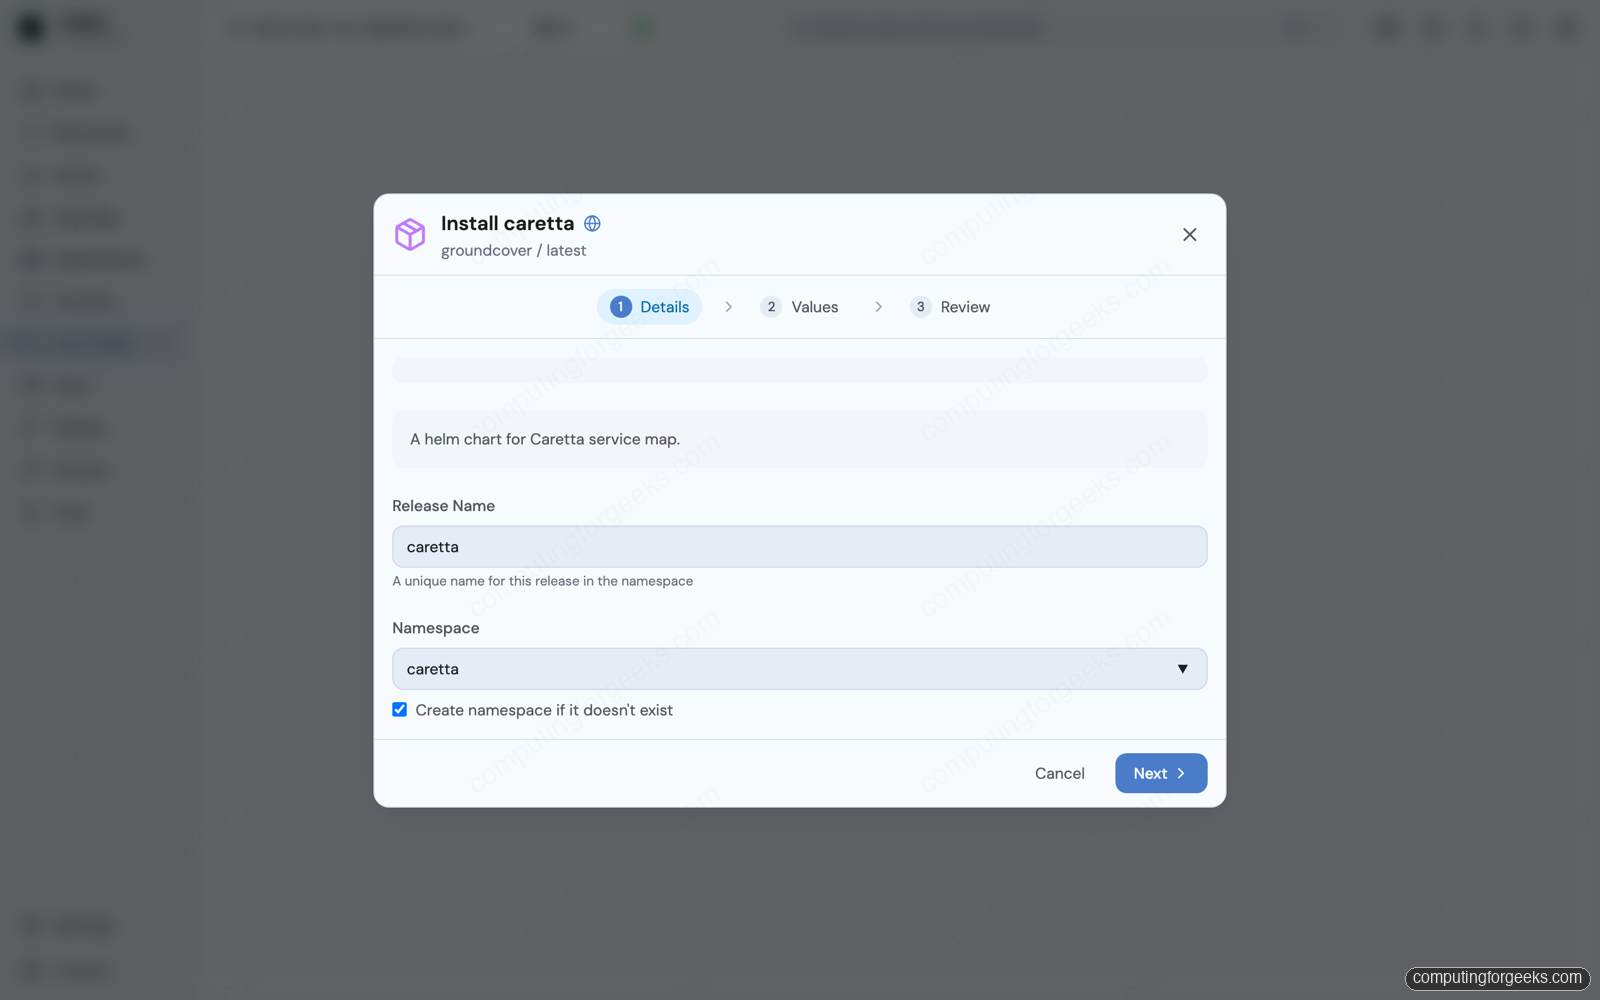
The wizard is Radar’s own Helm client: pick a release name and namespace, review the values, and it installs the chart for you. You can do the same thing by hand if you prefer to keep your Helm history clean:
helm repo add groundcover https://helm.groundcover.com
helm install caretta groundcover/caretta -n caretta --create-namespace
Here is the gotcha, and it is the one thing to check before you rely on this. Caretta loads an eBPF program and attaches kernel probes, so it needs a kernel that exposes the tracepoints it uses. On my stock Ubuntu 24.04 nodes it came up clean. The agent log is the proof:
BPF objects loaded
Kprobe attached successfully
Tracepoint attached successfully
On hardened or minimal kernels that strip syscall tracepoints (Talos is the usual culprit), that attach step fails and the caretta pods land in CrashLoopBackoff. It is not a Radar bug and it is not a caretta bug, it is a kernel feature that was compiled out, but it will leave your traffic map empty and you will waste an afternoon before you check kubectl logs on the agent. On a normal distro kernel you will not hit it. Once caretta is running and there is traffic to see, the Live Traffic view fills in:
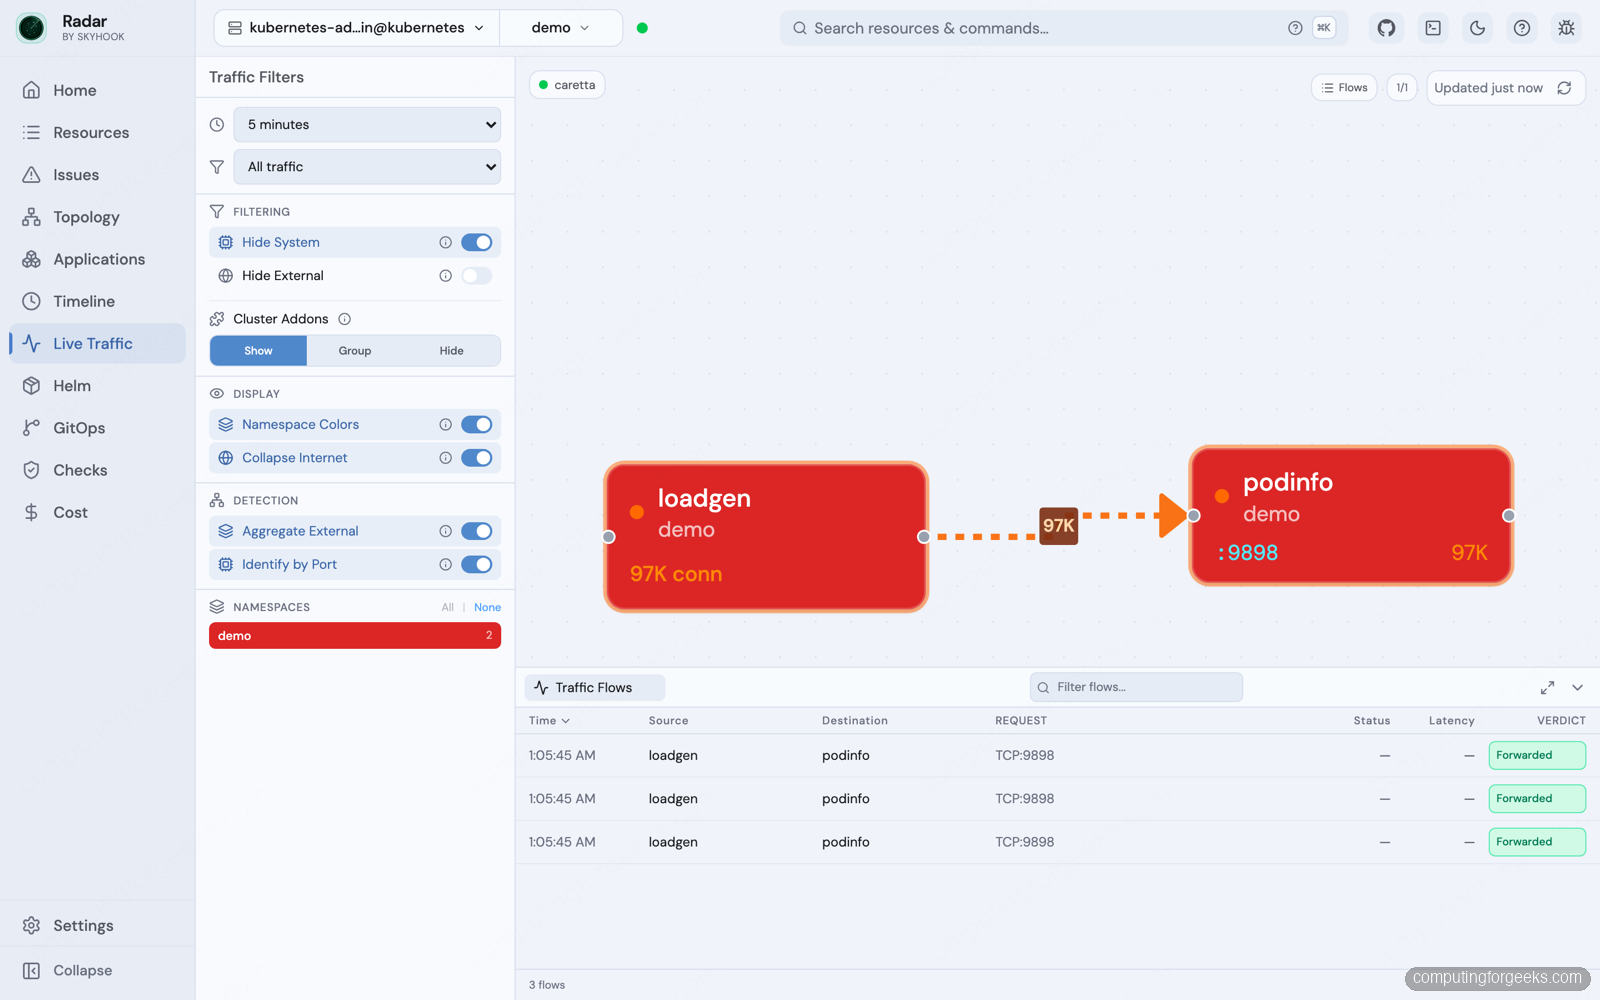
My load generator had been hammering podinfo for a while, and caretta captured it: a live edge from loadgen to podinfo on port 9898, tens of thousands of connections, with a per-flow table underneath showing each call and its verdict. That is real observed traffic from the kernel, not something inferred from Service selectors, which is what makes it trustworthy.
7. Audit the cluster against best practices
The Checks view runs Radar’s built-in best-practice checks across the whole cluster and turns the results into a remediation queue rather than a wall of warnings. The checks map to the usual frameworks (CIS, NSA/CISA, Polaris, Kubescape) and are grouped into Security, Reliability, and Efficiency.
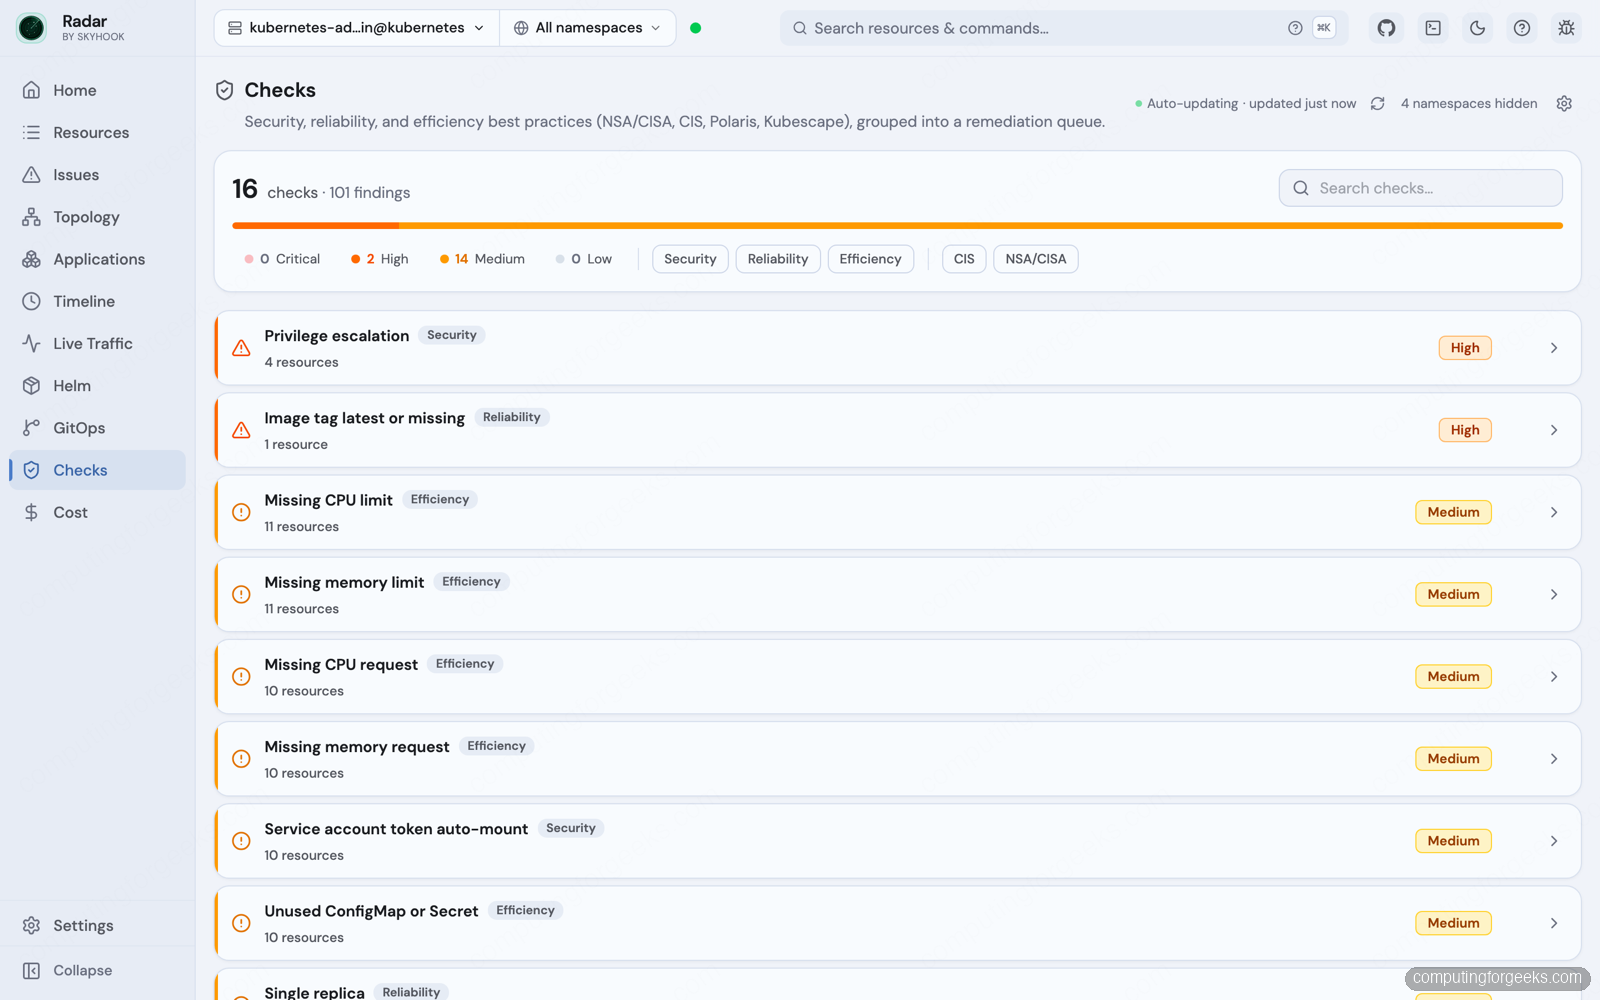
On my lab it ran 16 distinct checks and turned up 101 findings across them, which sounds alarming until you read them: mostly missing CPU and memory limits, service-account tokens auto-mounted where they are not needed, and a couple of higher-severity items like containers that allow privilege escalation and an image pinned to the latest tag. Each finding expands into why it matters and how to fix it, with a link to the relevant Kubernetes docs. None of it is a live outage, it is posture, and for a demo cluster that is exactly what you would expect. The value is that it is one click, not a separate scanner you have to wire in.
8. Ask Claude Code about your cluster
Here is the part that separates Radar from every other UI on the list. It ships a Model Context Protocol server, on by default, served over HTTP at /mcp. That means an AI coding agent can call Radar’s tools directly and answer questions about your live cluster in plain language. Radar exposes 28 of these tools, covering everything from a cluster dashboard and event lookups to pod logs, Prometheus queries, topology, and write actions like restarting or scaling a workload, all gated by your kubeconfig’s RBAC.
Wiring it into Claude Code is one command:
claude mcp add --transport http radar http://localhost:9280/mcpUse localhost if you are running kubectl radar on the same machine as Claude Code. Because I ran Radar on a node, I pointed it at that node’s address on the LAN instead. Confirm Claude Code can reach it:
claude mcp listThe radar server should report Connected. From there you can drop the kubectl-and-grep dance and just ask. I asked Claude Code to health-check the cluster using the radar tools, and it did:
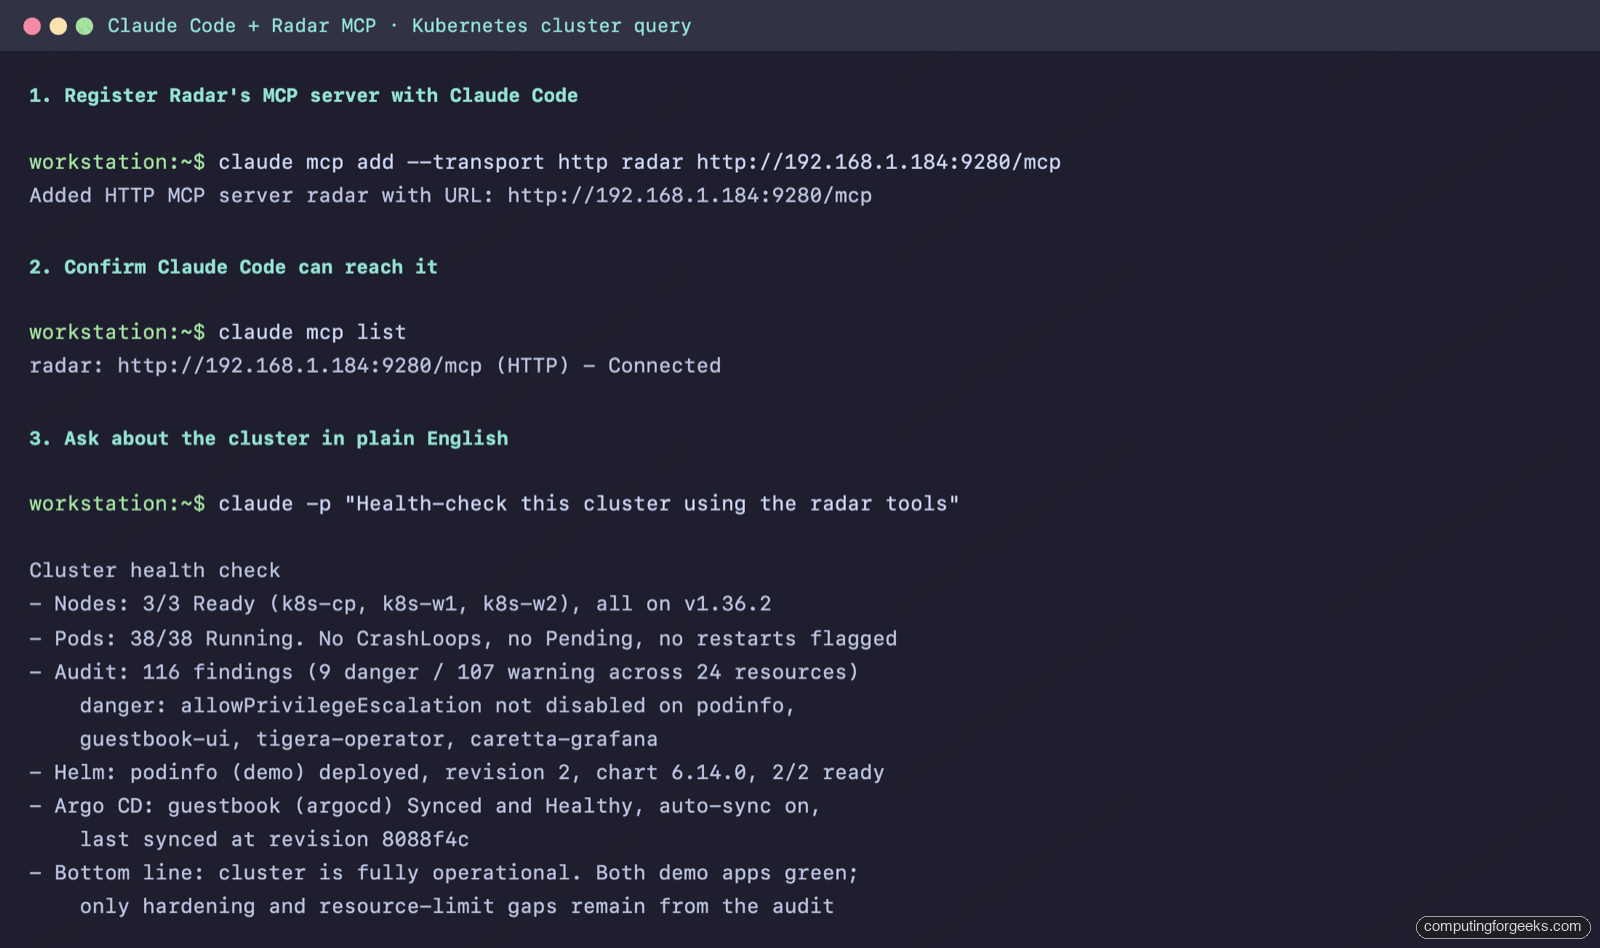
It came back with the node and pod counts, the top audit findings by severity, the podinfo Helm release status and revision, and the guestbook Argo CD sync and health, all pulled live through Radar’s tools rather than guessed. That is the difference between an AI that talks about Kubernetes in general and one that can actually read your cluster. If you already run an agent-driven workflow, this alone is a reason to keep Radar around.
Run Radar in-cluster for the whole team
Local mode is per-person. When you want one shared Radar for a team, install it into the cluster with Helm:
helm repo add skyhook https://skyhook-io.github.io/helm-charts
helm install radar skyhook/radar -n radar --create-namespace
That deploys Radar as a single pod behind a ClusterIP Service on port 9280. Confirm it is up:
kubectl -n radar get pods,svcThe pod goes Running within a few seconds and the Service is ready:
NAME                        READY   STATUS    RESTARTS   AGE
pod/radar-749f8bc9d5-55t8k   1/1     Running   0          20s

NAME            TYPE        CLUSTER-IP       PORT(S)    AGE
service/radar   ClusterIP   10.110.51.242    9280/TCP   20s
For anything a team touches over the network, do not leave it on plain HTTP. Put an ingress in front with a real certificate. Create the ingress manifest:
sudo vim radar-ingress.yamlPoint it at the Radar Service and terminate TLS with your issuer of choice (cert-manager here, driving a Let’s Encrypt certificate):
apiVersion: networking.k8s.io/v1
kind: Ingress
metadata:
  name: radar
  namespace: radar
  annotations:
    cert-manager.io/cluster-issuer: letsencrypt-prod
spec:
  ingressClassName: nginx
  tls:
    - hosts: ["radar.example.com"]
      secretName: radar-tls
  rules:
    - host: radar.example.com
      http:
        paths:
          - path: /
            pathType: Prefix
            backend:
              service:
                name: radar
                port:
                  number: 9280
Apply it, then front it with authentication before you hand out the URL, because in-cluster Radar has whatever access its ServiceAccount is granted:
kubectl apply -f radar-ingress.yamlIf you have not set up cert-manager and an ingress controller yet, the HTTP-01 flow works for any public DNS provider, and a private cluster can use a DNS-01 issuer instead. That is a topic in its own right, so scope the RBAC of the in-cluster ServiceAccount tightly and keep the shared instance behind SSO.
Open source vs Radar Cloud
Everything above is the free, Apache-2.0 build, and that is not a stripped trial. Local mode, in-cluster mode, topology, timeline, Helm and GitOps management, the audit, the eBPF traffic map, and the MCP server are all in the open source release with no seat limits.
Radar Cloud is the paid layer, and it is aimed at fleets rather than a single cluster. It adds cross-cluster aggregation, persistent event retention beyond what a local instance keeps, routed alerting to Slack, PagerDuty and the like, SSO with scoped RBAC, one-click in-cluster upgrades, and audit logging. There is also a self-hosted control plane chart (skyhook/radar-hub) if you want those features without sending data out. Pricing moves, so check the current numbers on Radar’s site rather than trusting a figure from a blog. For a homelab or a single production cluster, the open source build is the whole product.
When to reach for Radar over Lens, Headlamp, or k9s
Radar does not make the other tools pointless, so here is how I would actually choose between them after living with it for a bit.
Reach for Radar when you want the topology map, the audit, the traffic graph, and especially the MCP server in one binary you can hand to a teammate without a signup. The AI integration is the genuinely new thing here, and if you drive work through Claude Code or a similar agent, nothing else on this list gives it eyes on the cluster.
Stay on Lens if your team already pays for it and lives in its extensions and multi-cluster catalog. Pick Headlamp if you want a CNCF-governed, plugin-extensible dashboard and are happy running it as a desktop app or in-cluster; our Headlamp walkthrough covers that path. And keep k9s for what it is best at, which is blazing through resources from the terminal without ever touching a browser. Radar is closest to k9s in spirit (a single binary on your kubeconfig) while giving you the visual and AI surfaces k9s deliberately skips. If you also manage container hosts outside Kubernetes, Portainer still covers that wider ground.
For a free tool that installs in one command and reads a cluster it was pointed at five seconds ago, Radar earned a permanent spot in my kubeconfig rotation, mostly on the strength of the topology view and the MCP server. Point it at your own cluster and the topology map alone will probably win you over.