You have a handful of Linux boxes and a couple of Docker hosts, and no single place that shows whether any of them is short on memory or filling a disk. Beszel closes that gap. It is a lightweight, self-hosted monitor built from two pieces: a hub that serves the web dashboard, and a tiny agent that runs on each machine and reports back. Point the agents at the hub, and CPU, memory, disk, network, load, temperatures, and per-container Docker stats for every system land on one page.
This guide installs Beszel and wires the whole thing together end to end. We deploy the hub with Docker Compose, connect a first agent using the binary installer and a systemd service, add a second host with the containerized agent so both install methods are covered, then read the dashboard, drill into a single system, and set a threshold alert. Beszel ships under the MIT license, keeps all data on your own hardware, and needs no account with anyone.
Confirmed working with Beszel 0.18.7 in July 2026, hub on Ubuntu 26.04 and agent on Ubuntu 24.04.
How Beszel fits together
Beszel splits into a hub and one or more agents. The hub is the web dashboard and datastore in a single container, built on PocketBase, so it carries its own embedded database and user management. It stores history, renders the charts, and sends alerts.
The agent is a ~9 MB Go binary that runs on each monitored machine. It reads that host’s stats and opens a connection to the hub to report them. There is no external service in the loop and nothing is uploaded off your network, which makes Beszel comfortable to run on a private LAN or an air-gapped segment. The agent authenticates to the hub with a public key plus a token, so a random process on the network cannot register itself as one of your systems.
Two numbers explain why people reach for it. In our lab the systemd agent held around 14 MB of resident memory, and the containerized agent sat near 3 MB. That is the whole appeal: enough visibility to catch a runaway container or a full disk, at a footprint you forget is running.
Prerequisites and the test setup
The hub is genuinely light. Its container idled around 10 MB of memory in our lab, so sizing is driven by how much history you keep and how many systems report in, not by CPU. For a homelab or a small fleet of one to twenty systems, 1 vCPU and 512 MB to 1 GB of RAM on the hub is comfortable; give it more disk if you plan to retain months of per-minute history. The agent’s cost is negligible on any host it runs on. The two VMs below (2 vCPU / 4 GB each) are a floor for following along, not a recommendation to size a production hub that way.
What you need:
- A host for the hub with Docker and the Compose plugin. Our hub ran on Ubuntu 26.04; any recent Linux with Docker works. See installing Docker Engine if it is not there yet.
- One or more machines to monitor. Our agent host ran Ubuntu 24.04 with a few Docker containers so the container charts had real data.
- Port 8090 open on the hub for the dashboard and for agents to report in.
sudoor root on each machine.
Step 1: Set reusable shell variables
Two values recur through the agent steps: the hub URL and the public key the hub hands you. Export them once on each machine you configure so the later commands paste in as-is. On the agent hosts, run:
export HUB_URL="http://10.0.1.10:8090"
export BESZEL_KEY="ssh-ed25519 AAAAC3Nza...replace-with-your-hub-key"
export BESZEL_TOKEN="replace-with-your-universal-token"
You will collect the real key and token from the hub in Step 3. For now, swap 10.0.1.10 for your hub’s address and leave the other two as placeholders. Confirm the hub URL is set before going further:
echo "Hub: ${HUB_URL}"These variables live only in the current shell. If you reconnect over SSH, export them again.
Step 2: Deploy the hub with Docker Compose
On the hub host, create a working directory and the Compose file. Open it:
mkdir -p ~/beszel && cd ~/beszel
sudo vim ~/beszel/docker-compose.yml
Add the hub service. It publishes the dashboard on port 8090 and keeps its database in a local volume:
services:
  beszel:
    image: henrygd/beszel:latest
    container_name: beszel
    restart: unless-stopped
    ports:
      - 8090:8090
    volumes:
      - ./beszel_data:/beszel_data
      - ./beszel_socket:/beszel_socket
Start it:
sudo docker compose up -dConfirm the container is up and listening on 8090:
sudo docker ps --format 'table {{.Names}}\t{{.Image}}\t{{.Status}}\t{{.Ports}}'You should see the hub running with the port mapping:
NAMES     IMAGE                   STATUS         PORTS
beszel    henrygd/beszel:latest   Up 25 seconds   0.0.0.0:8090->8090/tcp
If UFW is active on the hub, allow the dashboard port so browsers and agents can reach it:
sudo ufw allow 8090/tcpOpen http://10.0.1.10:8090 in a browser. On first launch Beszel asks you to create an admin account. Set an email and a strong password, then create it. That account owns the hub and its settings.
Step 3: Get the connection details from the hub
The agents authenticate with a public key and a token that the hub generates. Click Add System in the top right. The dialog carries everything the agent needs: a name, host and port fields, the hub’s Public Key, and a Token. The Docker and Binary tabs switch between a ready-made Compose block and the values for a binary install.
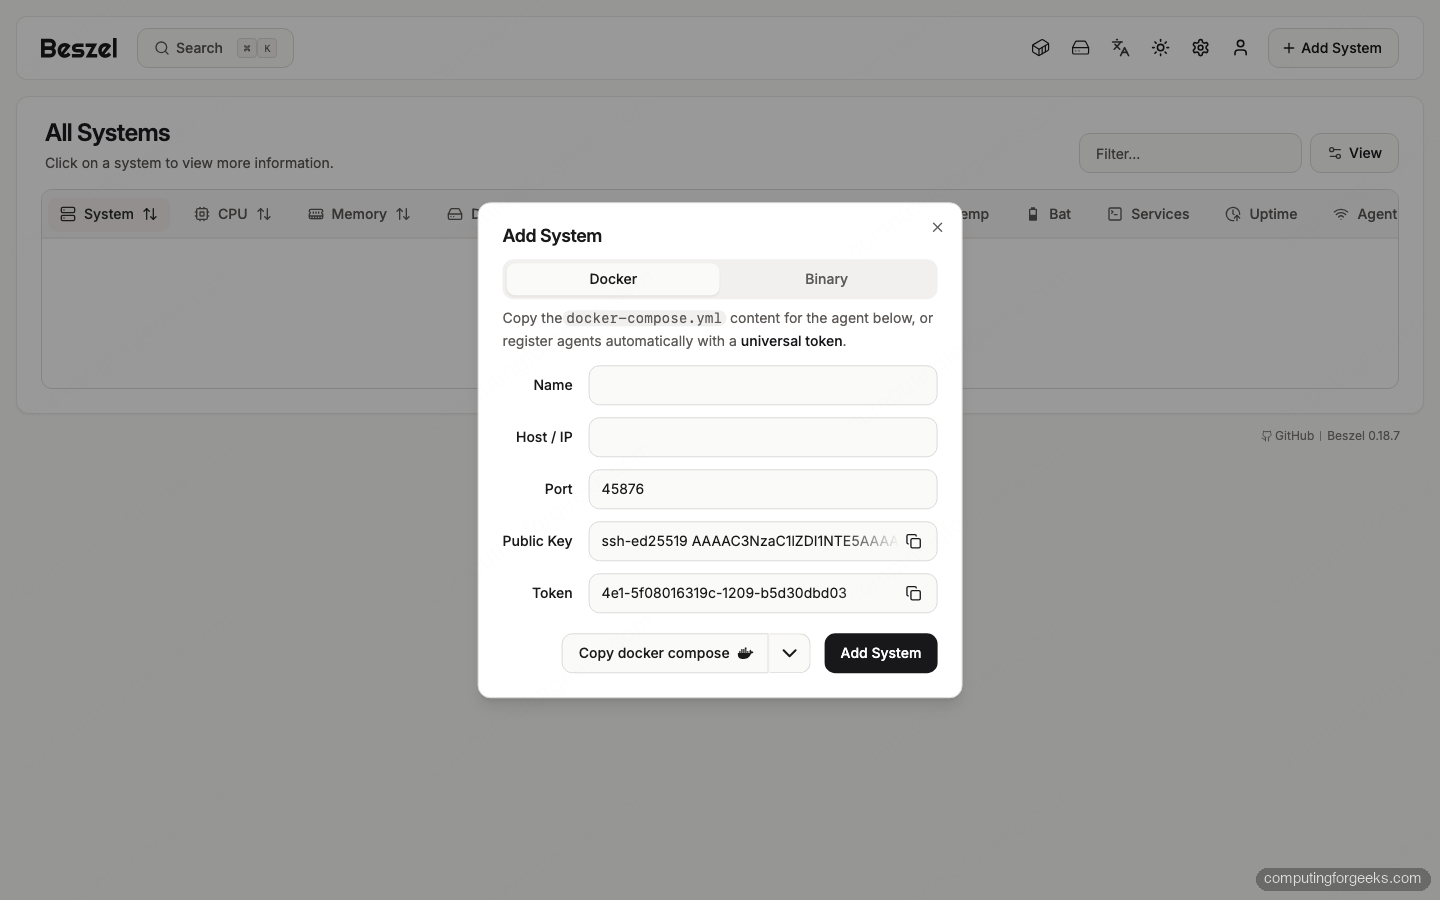
You can add each system by hand this way, but the faster path for a fleet is a universal token: one token that lets any agent self-register on first connection. Go to Settings, then Tokens & Fingerprints, and enable the universal token. Copy the token value shown next to the switch.
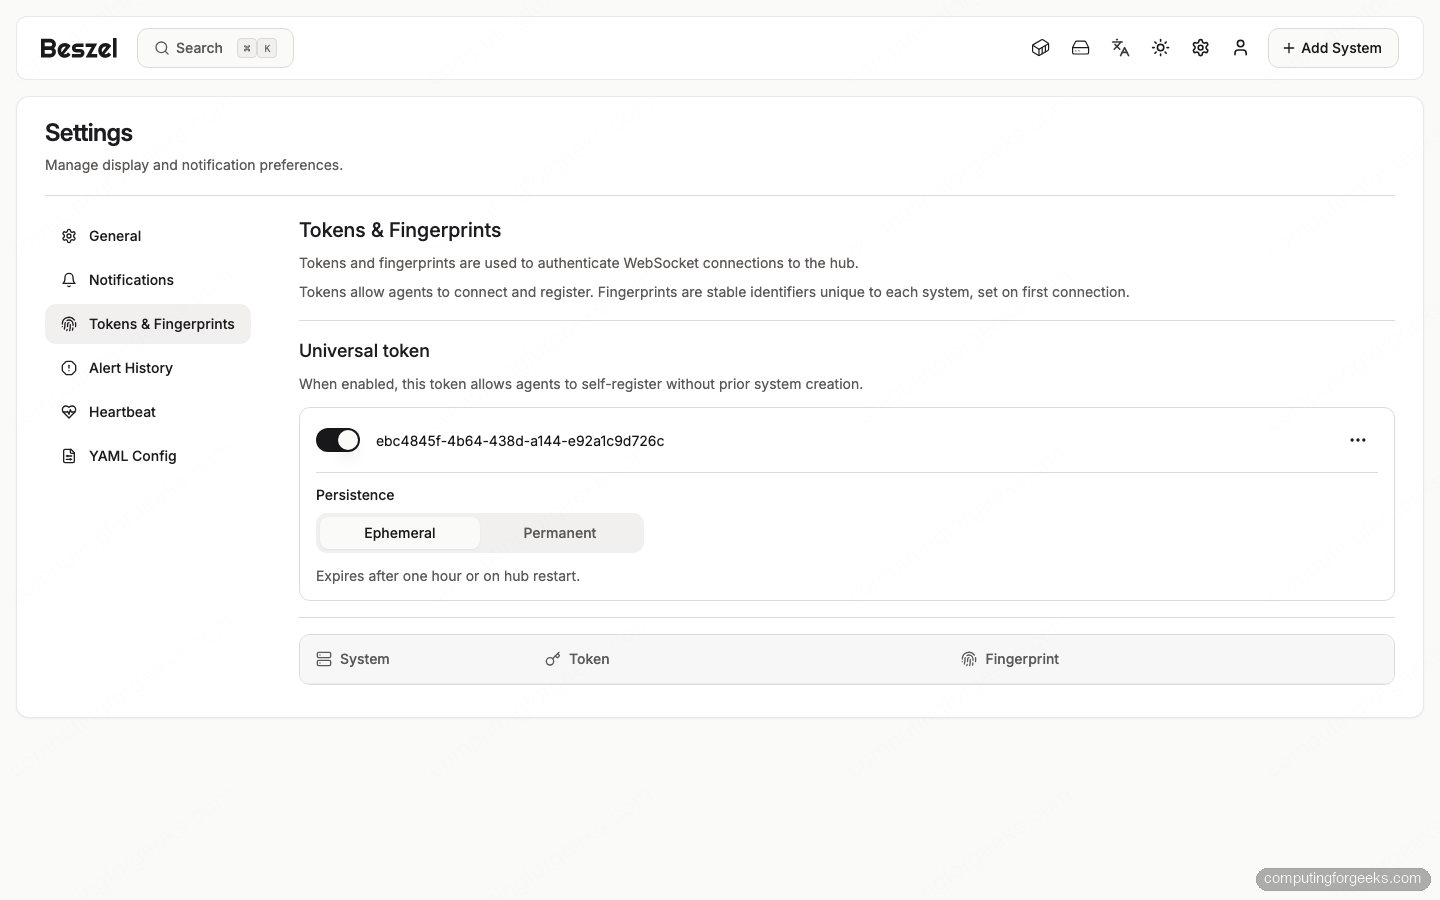
The persistence setting matters here. An ephemeral token expires after an hour or when the hub restarts, which is fine while you register a batch of agents in one sitting. Switch it to permanent only if you want agents to keep self-registering indefinitely. Copy the public key from the Add System dialog and the universal token, then set them in the variables you exported in Step 1:
export BESZEL_KEY="ssh-ed25519 AAAAC3NzaC1lZDI1NTE5AAAA...your-hub-key"
export BESZEL_TOKEN="ebc4845f-4b64-438d-a144-e92a1c9d726c"
With the real key and token in place, connecting an agent is a single command.
Step 4: Install the agent with the binary installer
On the machine you want to monitor, the official installer downloads the agent binary, creates a dedicated user, and sets up a systemd service in one pass. Run it with the hub URL, key, and token from the variables:
curl -sL https://get.beszel.dev -o /tmp/install-agent.sh && chmod +x /tmp/install-agent.sh
sudo /tmp/install-agent.sh -k "${BESZEL_KEY}" -t "${BESZEL_TOKEN}" -url "${HUB_URL}"
The installer reports success and starts the service. Confirm the version and that systemd has it running, then read the log to see the agent reach the hub:
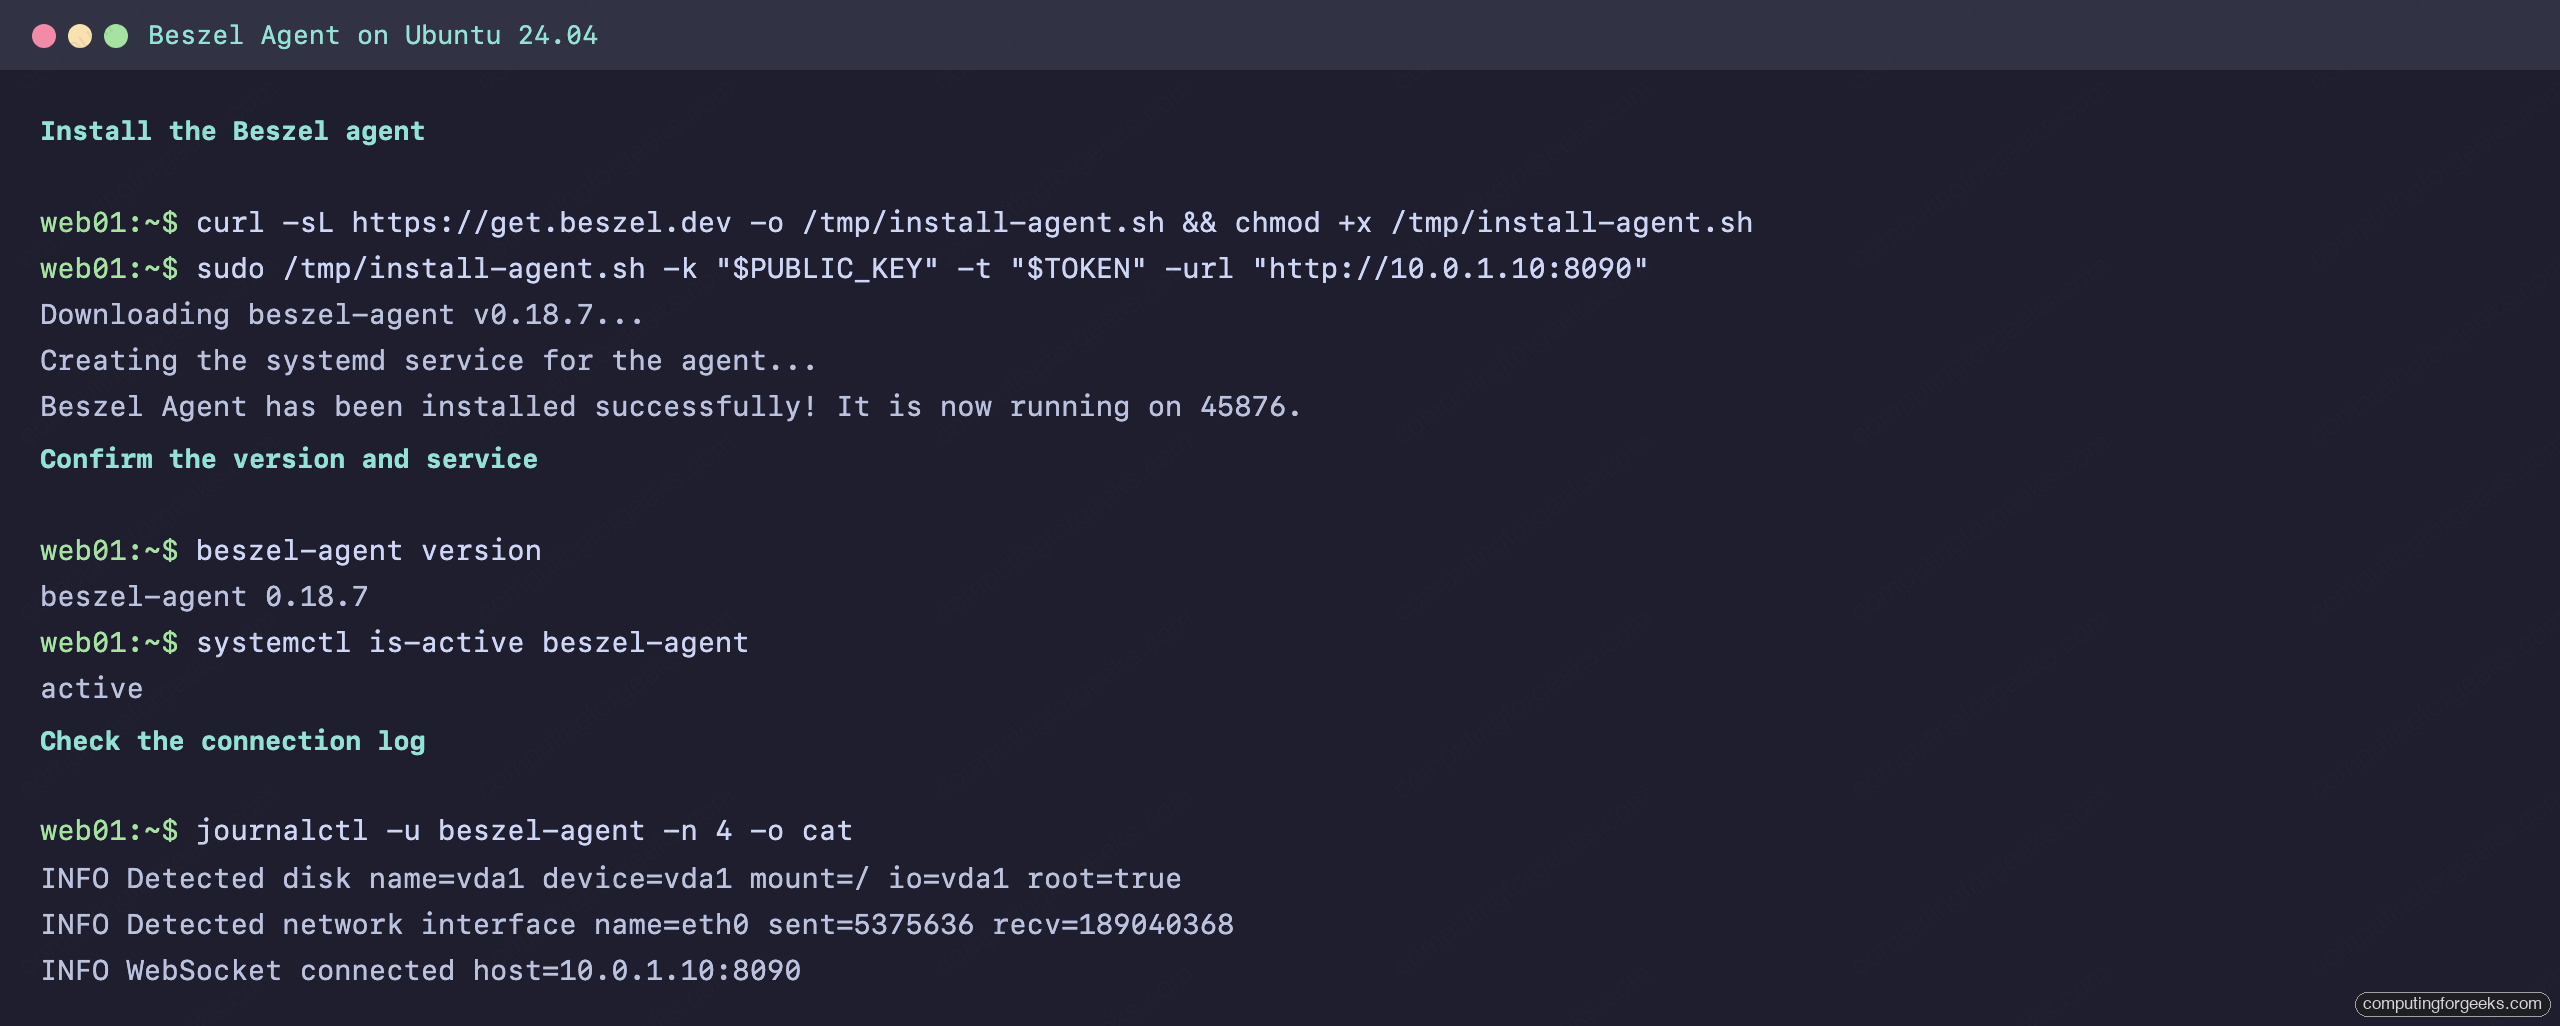
The line that matters is WebSocket connected. The agent dialed out to the hub on port 8090 and registered itself with the universal token, so nothing inbound needs to be opened on this host. The agent also listens on 45876 for the older direct-connection method, but the token flow used here does not depend on it. If the log instead shows unexpected status code: 401, the token is wrong or the universal token is not enabled; re-copy it from Settings and restart with sudo systemctl restart beszel-agent.
Step 5: Add a Docker host with the container agent
On a host that already runs Docker, the agent is often cleaner as a container than as a system service. It needs host networking to read real interface stats and a read-only mount of the Docker socket to see the other containers. Create its Compose file:
mkdir -p ~/beszel-agent && cd ~/beszel-agent
sudo vim ~/beszel-agent/docker-compose.yml
Add the agent service, pasting your real key and token where shown. A Compose file does not read the shell variables you exported earlier, so put the literal key and token here rather than ${BESZEL_KEY}:
services:
  beszel-agent:
    image: henrygd/beszel-agent:latest
    container_name: beszel-agent
    restart: unless-stopped
    network_mode: host
    volumes:
      - ./beszel_agent_data:/var/lib/beszel-agent
      - /var/run/docker.sock:/var/run/docker.sock:ro
    environment:
      LISTEN: 45876
      KEY: "ssh-ed25519 AAAAC3NzaC1lZDI1NTE5AAAA...your-hub-key"
      TOKEN: "ebc4845f-4b64-438d-a144-e92a1c9d726c"
      HUB_URL: "http://10.0.1.10:8090"
The read-only socket mount is what lets a container agent report the CPU and memory of every other container on that host without any elevated privileges. Bring it up:
sudo docker compose up -dCheck that it connected:
sudo docker logs beszel-agent | tail -n 3The last line should again read WebSocket connected, and the system appears in the dashboard within a few seconds.
Read the dashboard
The home page lists every system in one table: CPU, memory, disk, GPU, load average, network throughput, monitored services, and uptime, with a green dot for healthy. Both of our hosts reported in, and the binary agent picked up the host’s systemd services too, shown as a running count with failures called out.
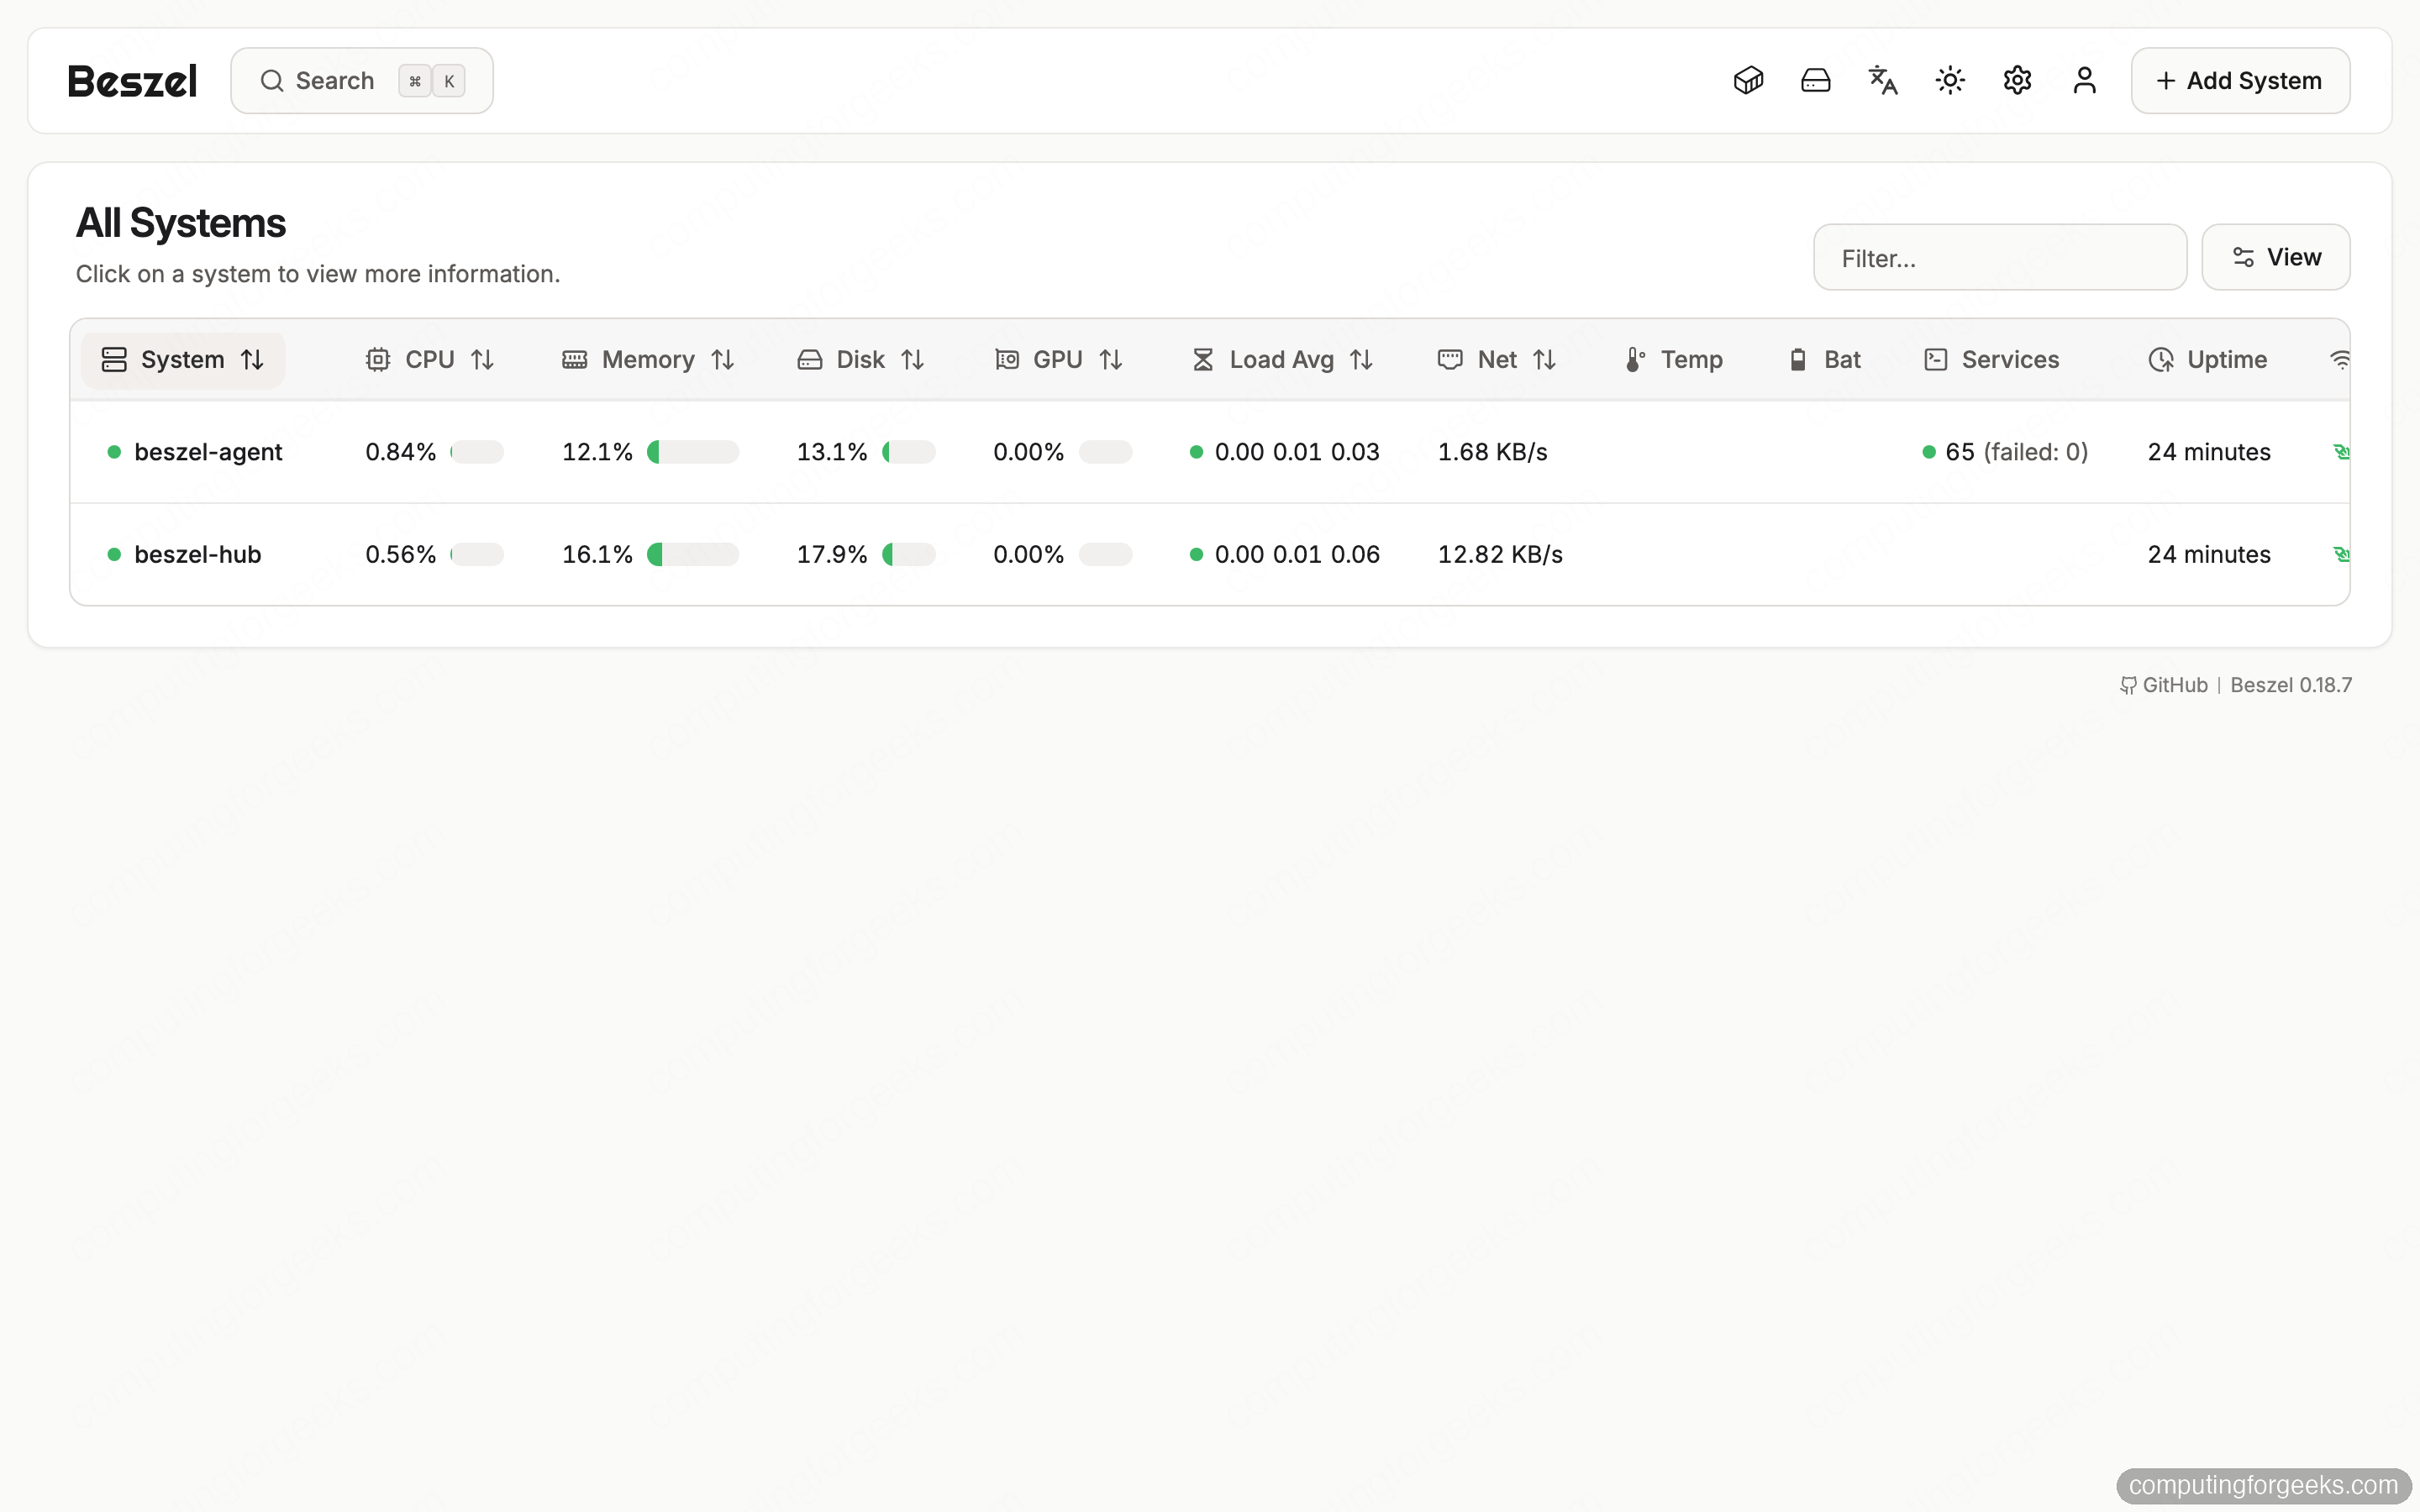
This overview is the whole point of the hub-and-agent design. One glance tells you which box needs attention, and the sort arrows let you order by any column when a fleet grows past a screenful.
Drill into one system
Click a system to open its detail page. The header shows uptime, the OS, the CPU model, and total memory, and below it Beszel draws separate charts for system CPU, memory, disk usage, disk I/O, and bandwidth. Alongside each, the Docker panels break the same resource down per container: Docker CPU Usage, Docker Memory Usage, and Docker Network I/O all stack the containers so you can see which one is eating the host.
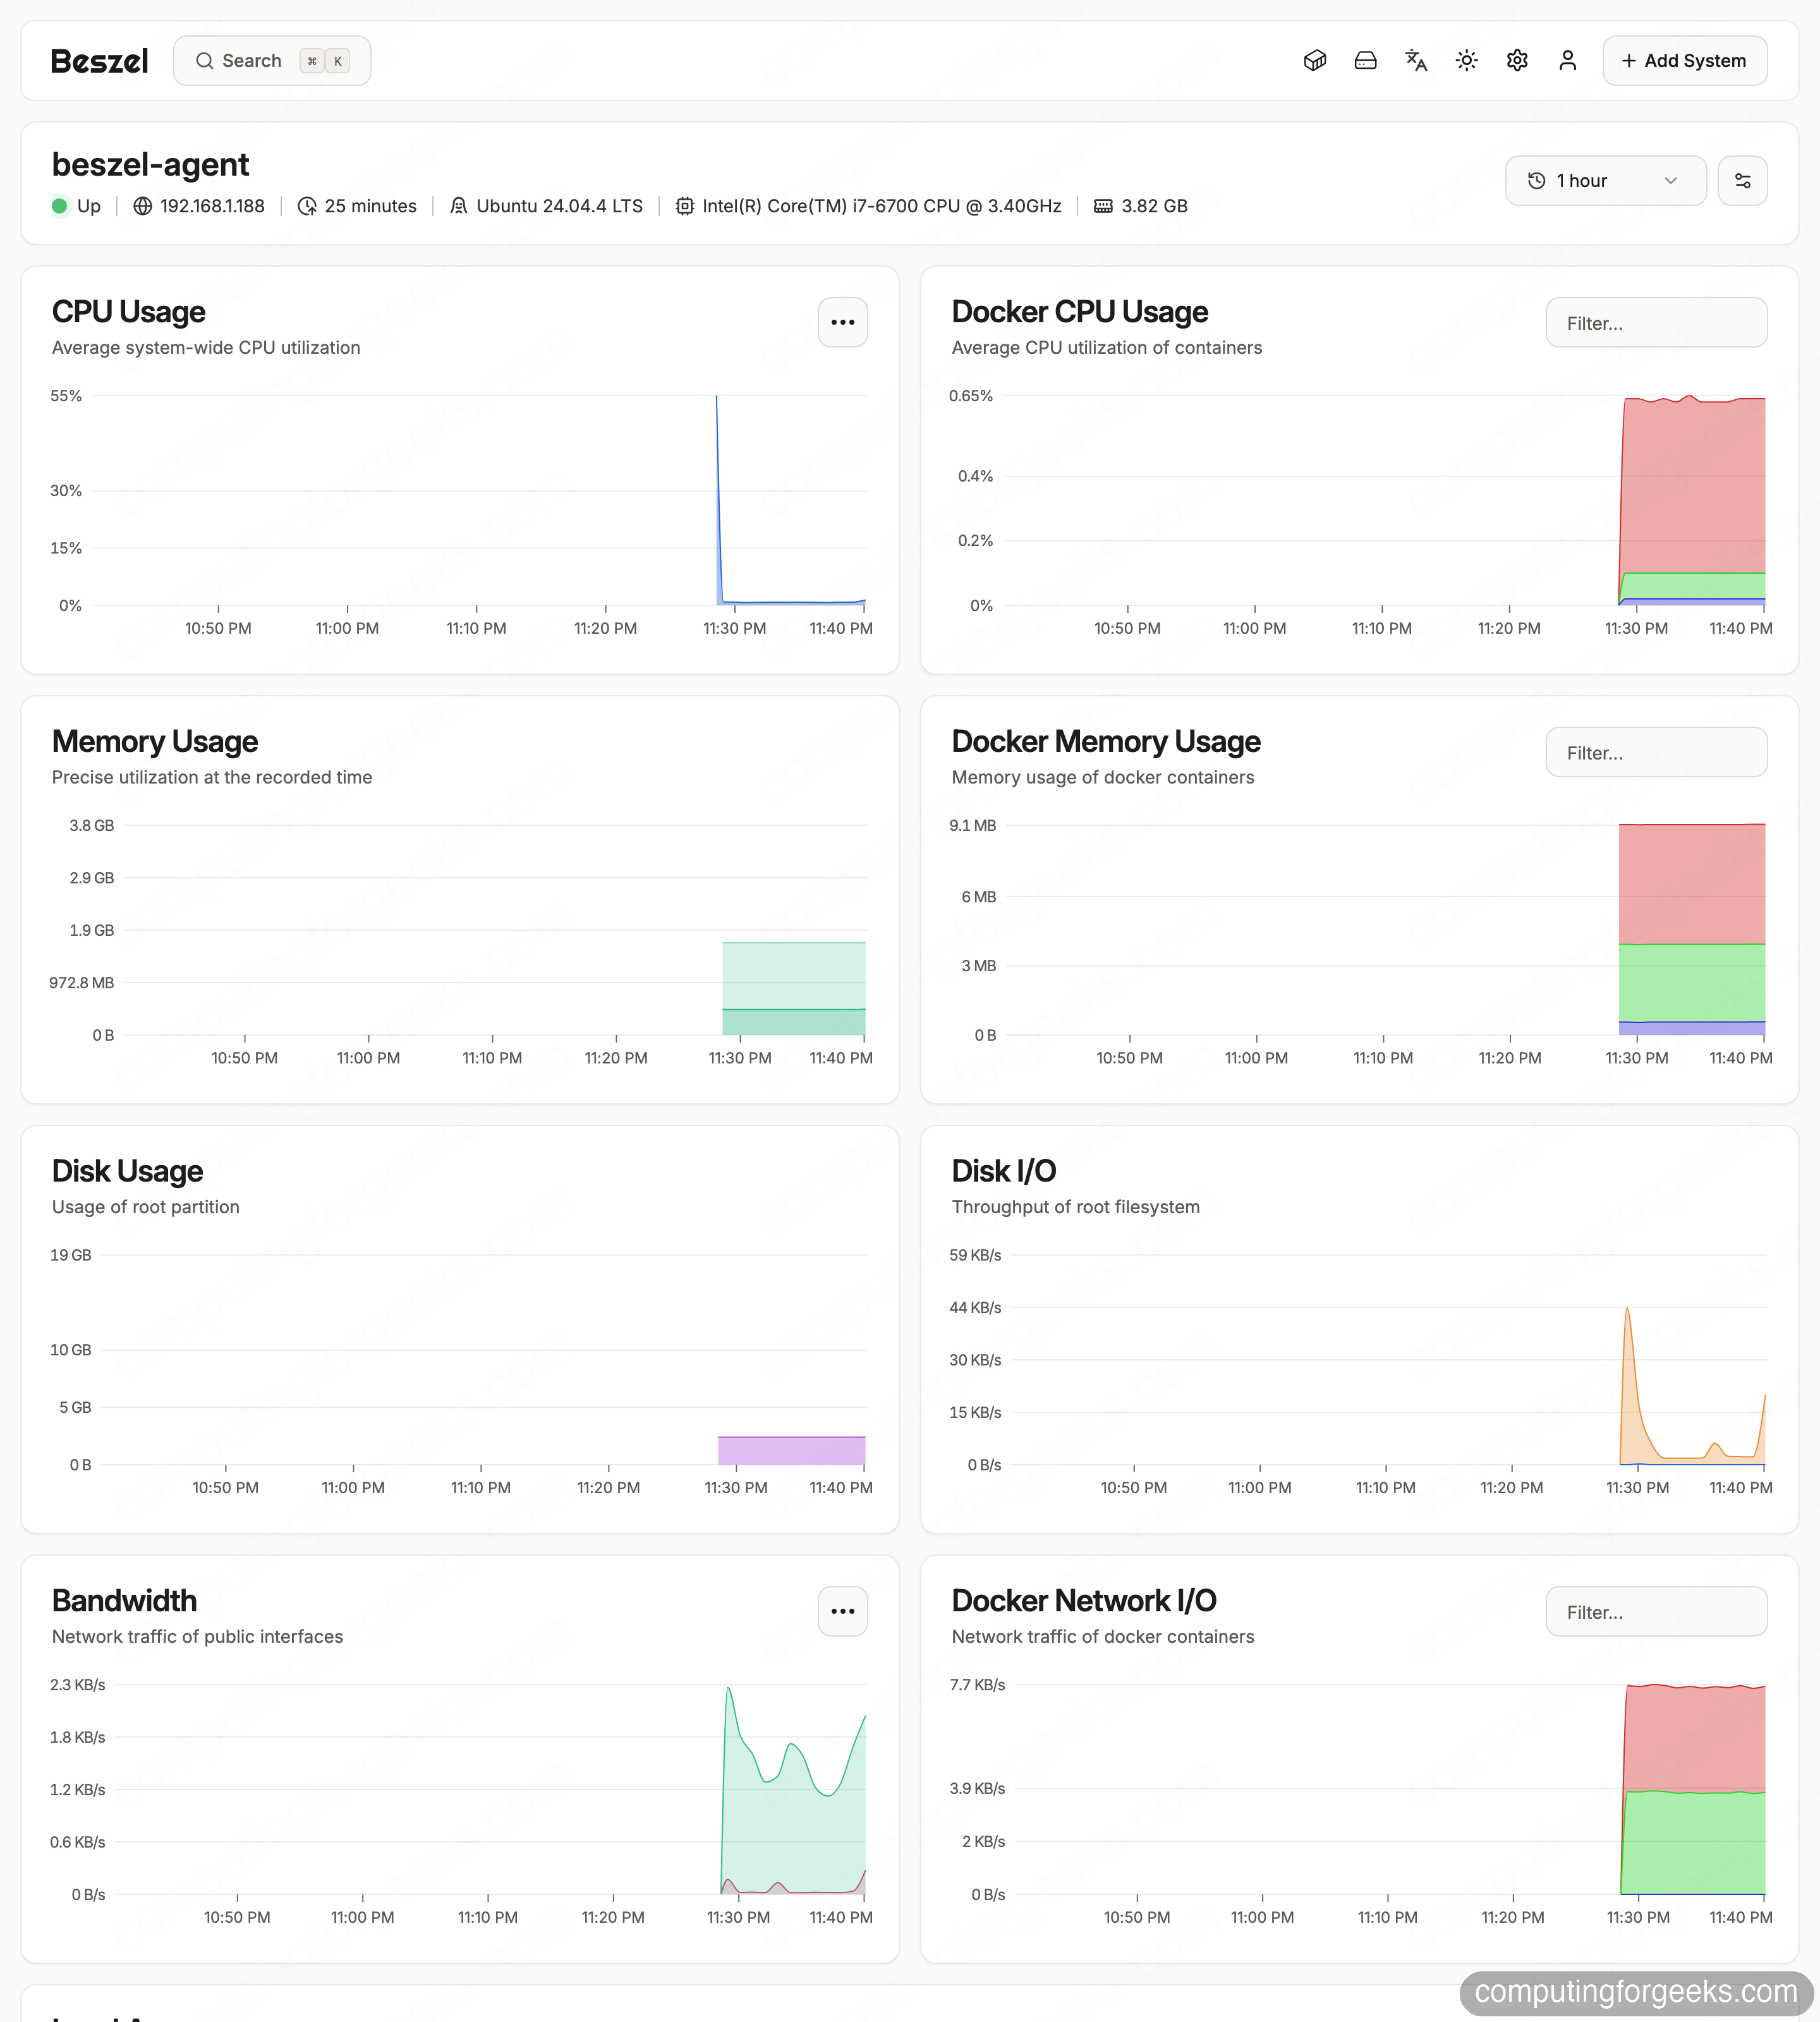
The container breakdown is where Beszel earns its keep on a Docker host. Instead of a single host-level memory line, you get each container’s slice, so a leak in one service is obvious rather than buried in the total. Beszel reads the same data on hosts with Nvidia, AMD, or Intel GPUs and on drives that expose S.M.A.R.T., surfacing GPU load and drive health next to the rest.
Set a threshold alert
Charts are only useful when you are looking at them, so Beszel sends alerts when a metric crosses a line you set. Hover a system row and click the bell, or open the alerts panel, and toggle on the metric you care about. Each one exposes a threshold and a duration, so you can say “CPU above 80% for 10 minutes” and avoid being paged for a brief spike.
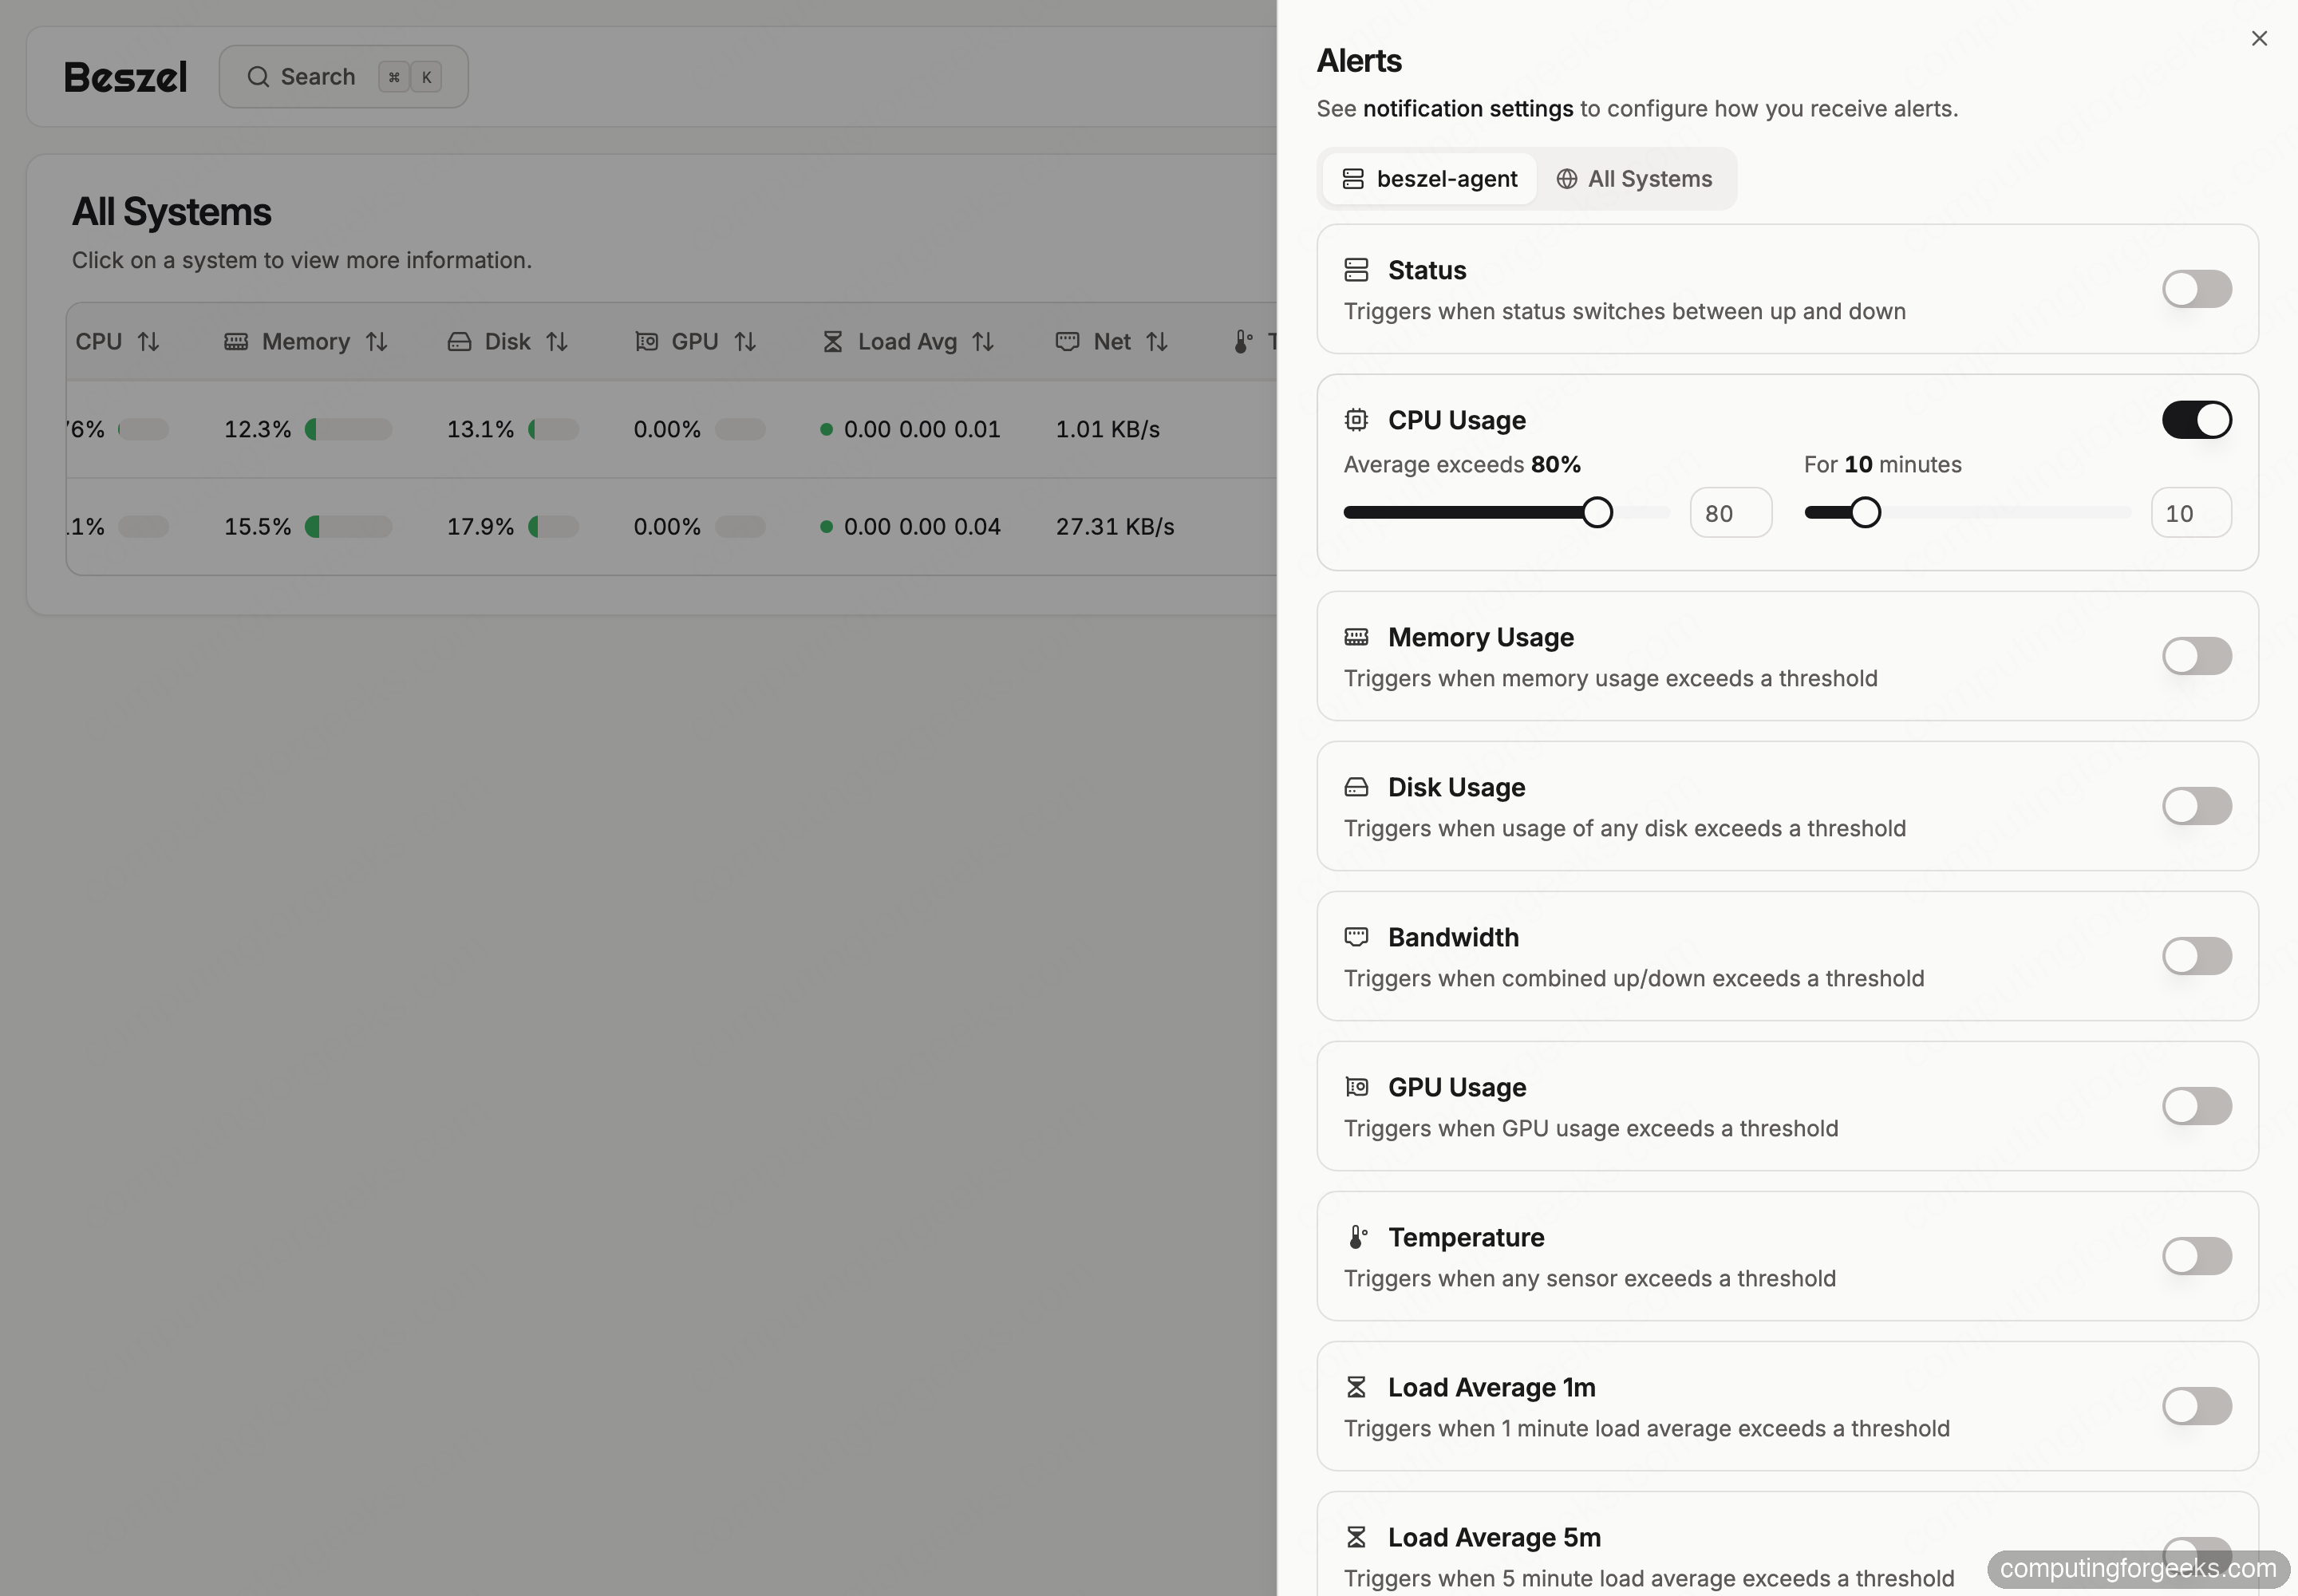
Status, CPU, memory, disk, bandwidth, GPU, temperature, the three load averages, and battery each get their own toggle, and the “All Systems” tab applies one rule across the whole fleet at once. Where those alerts go, email, a webhook, or a push service, is configured under Settings, then Notifications. A status alert alone, which fires when a system stops reporting, is worth turning on everywhere for early warning that a host went dark.
When to pick Beszel over Netdata or Glances
Beszel is not trying to be everything, and that is the decision. Reach for it when you want a single dashboard across a small fleet, you care about CPU, memory, disk, network, and per-container Docker stats, and you want the monitoring itself to cost almost nothing. For one to twenty hosts that you check daily, it is hard to beat: the agent’s footprint is a rounding error, setup is minutes, and there is no cloud account or paid tier anywhere in the picture.
Reach for Netdata instead when you need deep, per-second diagnostics on a specific host: thousands of auto-discovered metrics, on-agent anomaly detection, and drill-downs Beszel does not attempt. That power has a price, Netdata’s own docs put a node at 100 to 200 MB of RAM on an empty system and 250 to 350 MB in typical production, against Beszel’s sub-15 MB agent, so it fits “diagnose this one box in detail” better than “watch fifty boxes cheaply”. Prometheus and Grafana sit further along the same axis: far more capable, far more to run and maintain, and the right call once you need custom queries, long retention, and dashboards you build yourself.
A common and sane split is to run Beszel as the always-on overview across everything, pair it with Uptime Kuma for service status pages, and only stand up Netdata or a Prometheus stack on the handful of hosts that genuinely need the depth. Start with Beszel, add weight where the questions get harder.