Grafana is an open-source visualization and analytics platform used by operations teams to monitor infrastructure and application metrics. It connects to data sources such as Prometheus, InfluxDB, Elasticsearch, PostgreSQL, and Loki, letting you build dashboards that turn raw time-series data into something you can actually act on. This guide walks through a production-ready Grafana 11.x deployment on Ubuntu 24.04 (Noble Numbat) and Debian 13 (Trixie), from package installation all the way to reverse-proxy hardening, authentication, and infrastructure-as-code provisioning.
Last verified: March 2026 | Tested on Ubuntu 24.04 LTS with Grafana 12.4.1, Prometheus 2.45.3, Nginx 1.24.0
Prerequisites
Before you start, make sure you have the following in place:
- A server running Ubuntu 24.04 or Debian 13 with at least 1 CPU core, 1 GB RAM, and 10 GB of free disk space.
- A non-root user with
sudoprivileges. - A working Prometheus installation if you plan to follow the data-source and dashboard sections.
- A registered domain name pointed at your server (required for the Nginx SSL section).
- Ports 3000/tcp (Grafana default) and 443/tcp (HTTPS) open in your firewall.
Update your package index and install a few dependencies that the rest of the guide relies on:
sudo apt update && sudo apt install -y apt-transport-https software-properties-common wget curl gnupgStep 1: Add the Grafana APT Repository and Install Grafana OSS
Grafana Labs maintains a signed APT repository for Debian-based distributions. Start by importing the GPG signing key:
sudo mkdir -p /etc/apt/keyrings
wget -q -O - https://apt.grafana.com/gpg.key | gpg --dearmor | sudo tee /etc/apt/keyrings/grafana.gpg > /dev/null
Next, add the stable repository. This single line works on both Ubuntu 24.04 and Debian 13:
echo "deb [signed-by=/etc/apt/keyrings/grafana.gpg] https://apt.grafana.com stable main" | sudo tee /etc/apt/sources.list.d/grafana.listNow refresh the package cache and install Grafana OSS:
sudo apt update
sudo apt install -y grafana
After the install finishes, verify the version:
grafana-server -vYou should see output that starts with Version 11. followed by the patch number. If you need the Enterprise edition instead, replace grafana with grafana-enterprise in the install command above. The Enterprise package is free for single-instance use and adds features like enhanced LDAP support and reporting.
Step 2: Enable and Start the Grafana Service
Grafana ships a systemd unit file. Enable it so the service starts on boot, then start it immediately:
sudo systemctl enable --now grafana-serverCheck the status to confirm it is running without errors:
sudo systemctl status grafana-serverThe output should show active (running). Grafana listens on TCP port 3000 by default. Confirm the port is open:
ss -tlnp | grep 3000If your server runs ufw, allow the port:
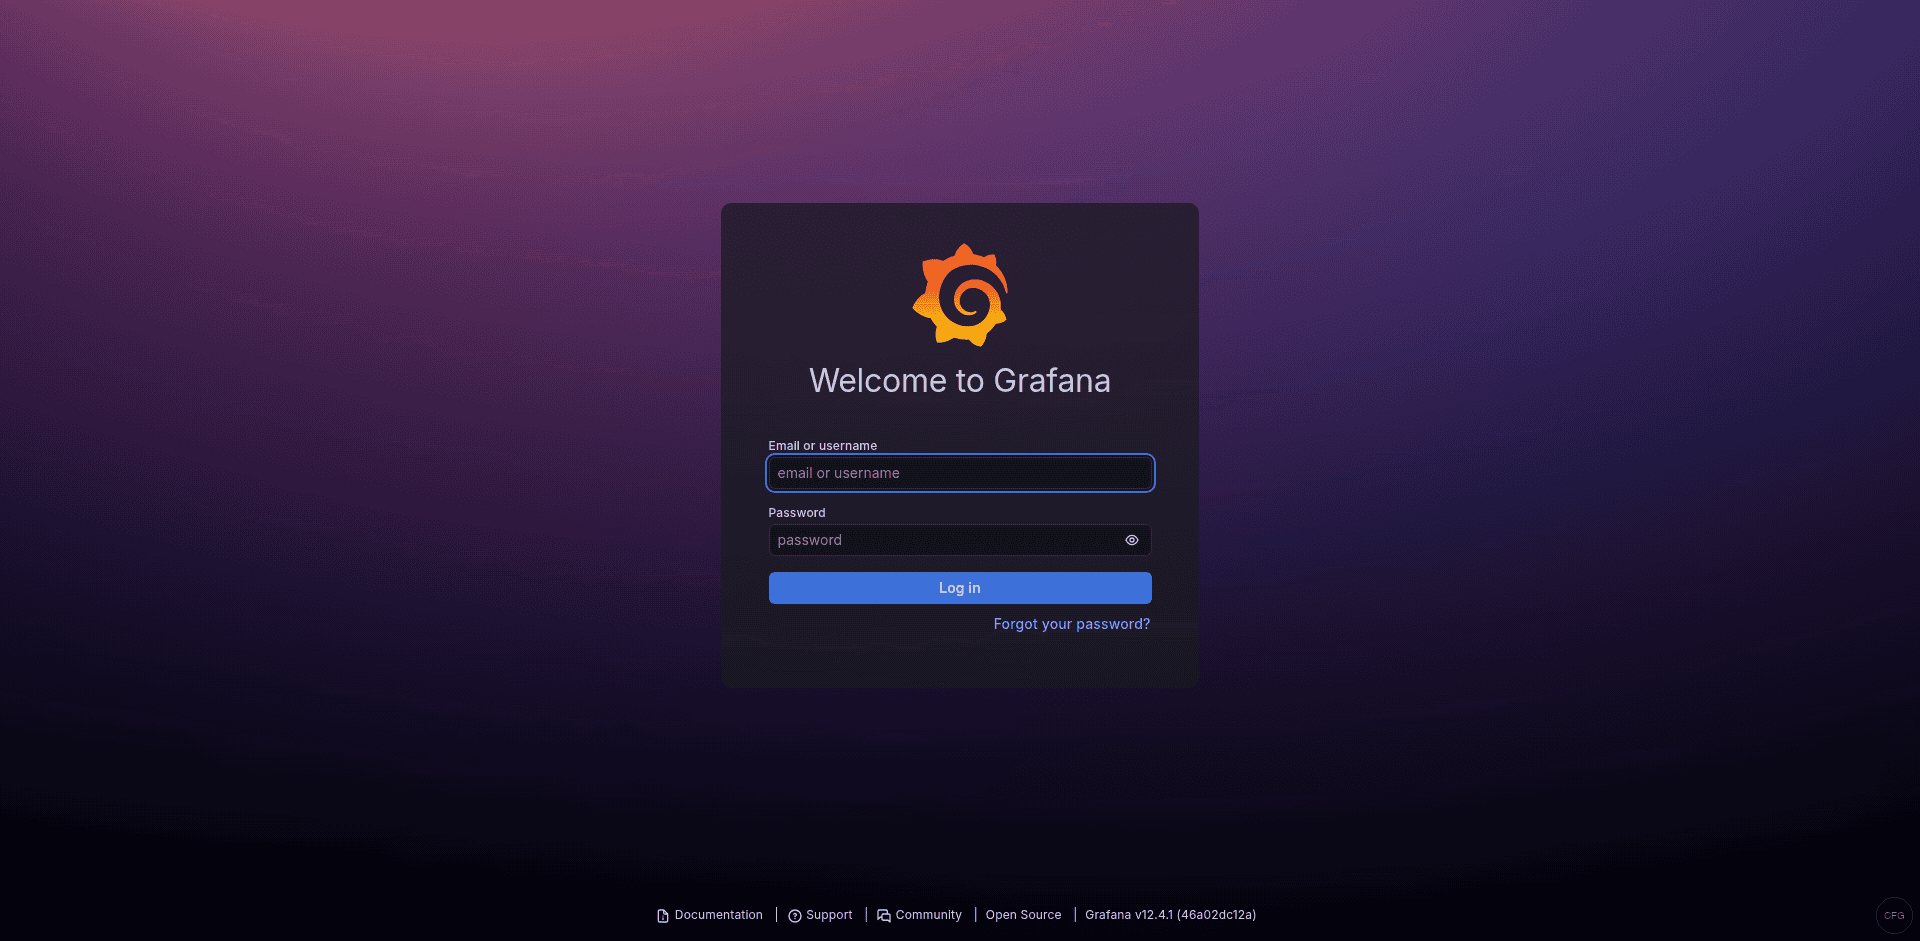
sudo ufw allow 3000/tcpOpen your browser and navigate to http://<server-ip>:3000. You should see the Grafana login screen.
Step 3: Initial Login and Password Change
The default credentials are admin for both the username and the password. After your first login, Grafana forces you to set a new password.
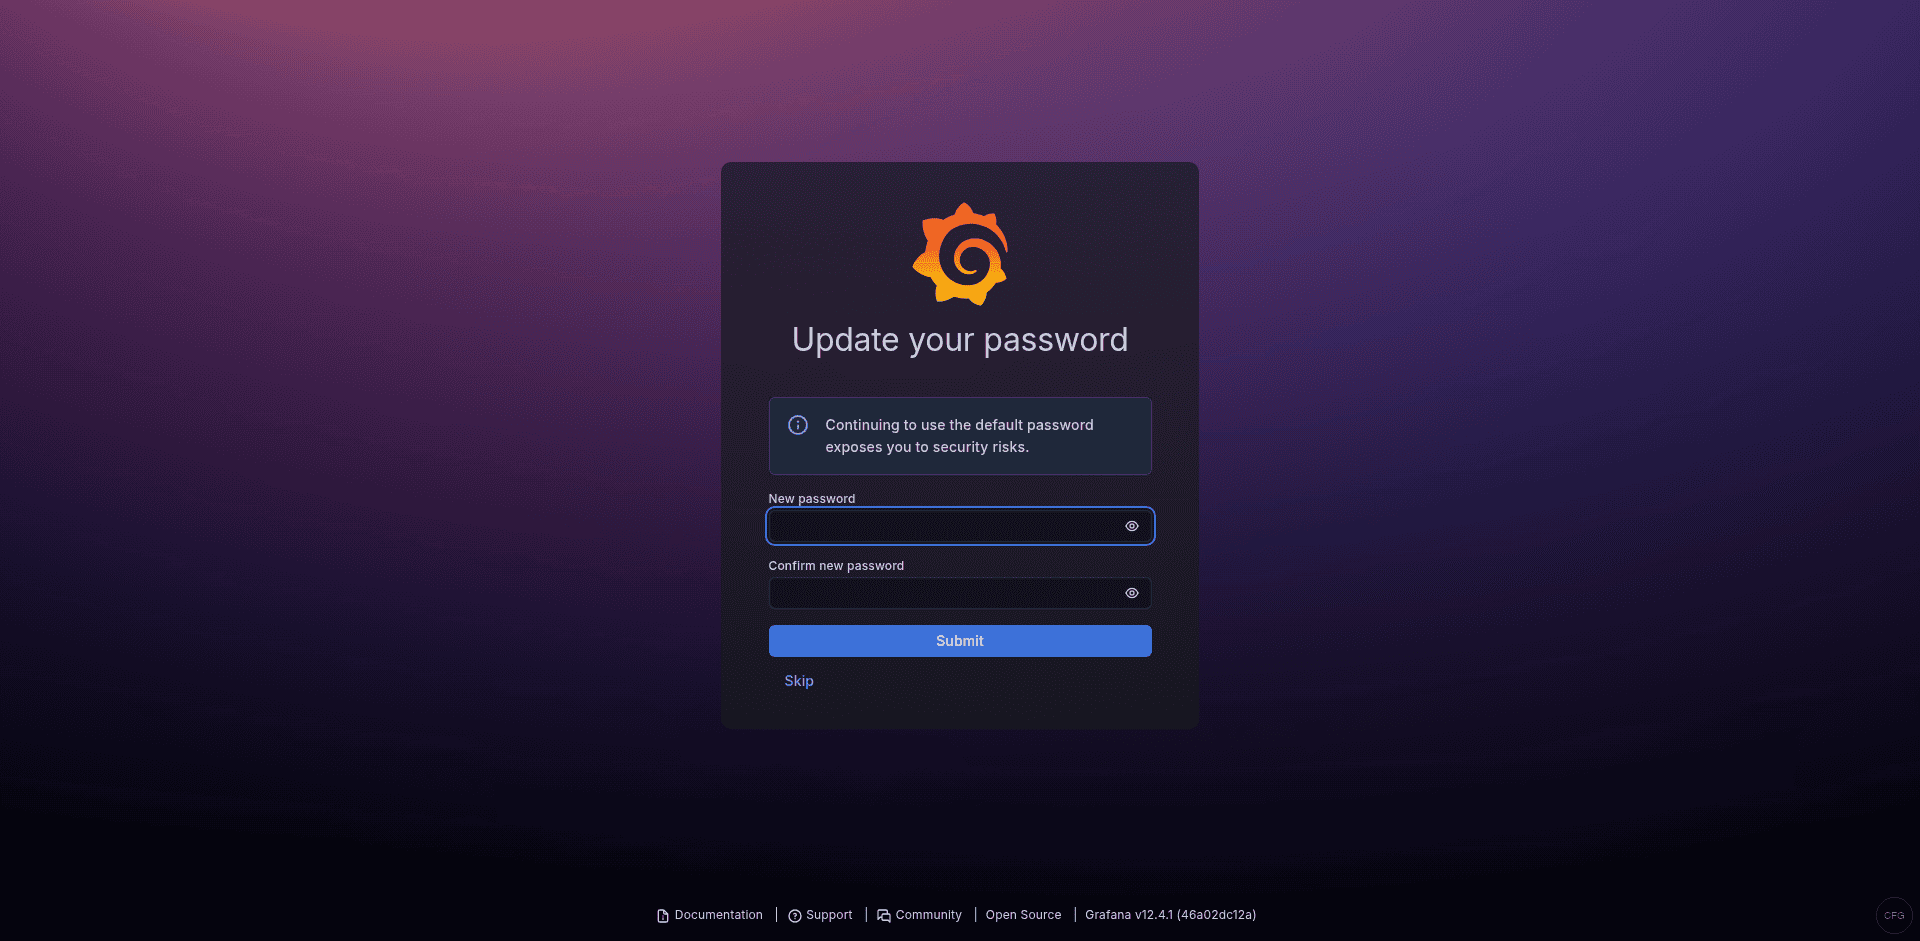
Pick something strong and store it in your password manager. If you ever need to reset a forgotten admin password from the command line:
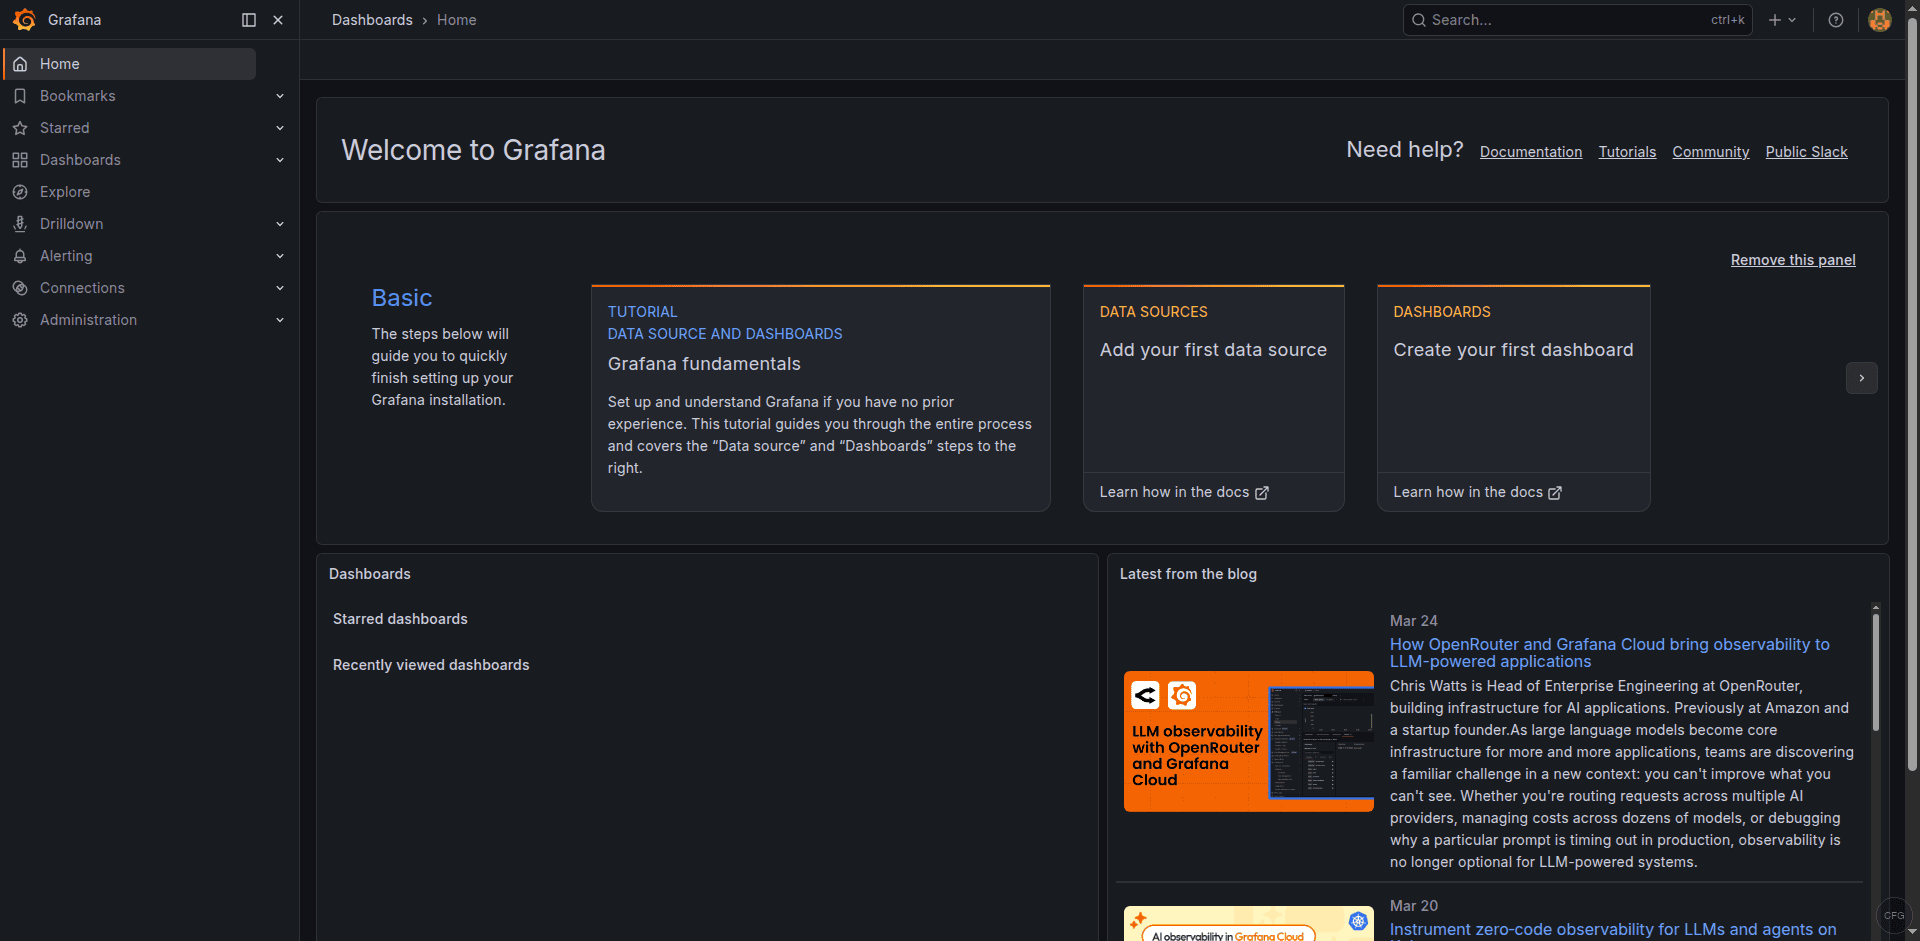
sudo grafana-cli admin reset-admin-password YourNewSecurePasswordOnce you log in, take a moment to explore the left sidebar. Grafana 11.x has reorganized the navigation. Dashboards, Alerting, and Connections (data sources) are the three areas you will use the most.
Step 4: Add Prometheus as a Data Source
If you already have Prometheus running, connecting it to Grafana takes about 30 seconds.
Navigate to Connections > Data sources > Add data source. Select Prometheus from the list.
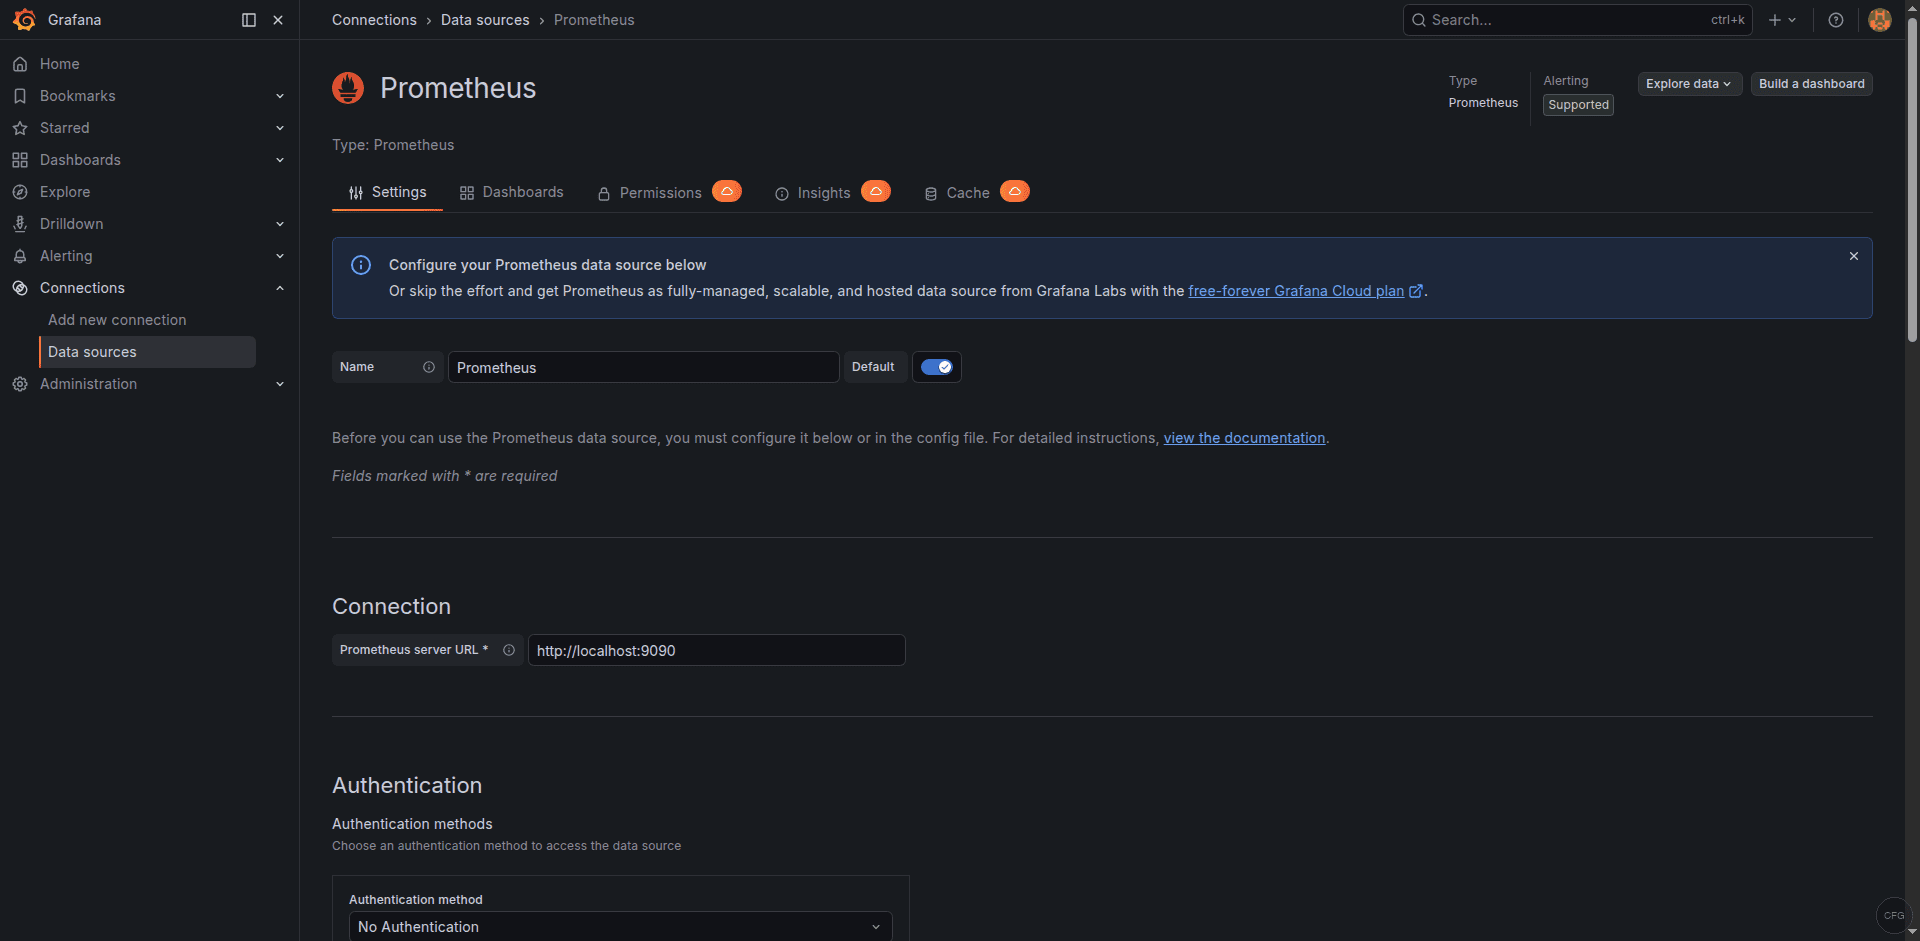
In the Prometheus server URL field, enter the address where Prometheus is reachable, for example:
http://localhost:9090Scroll down and click Save & test. Grafana will run a quick query against the Prometheus API. If you see a green banner that says “Successfully queried the Prometheus API,” the connection is good.
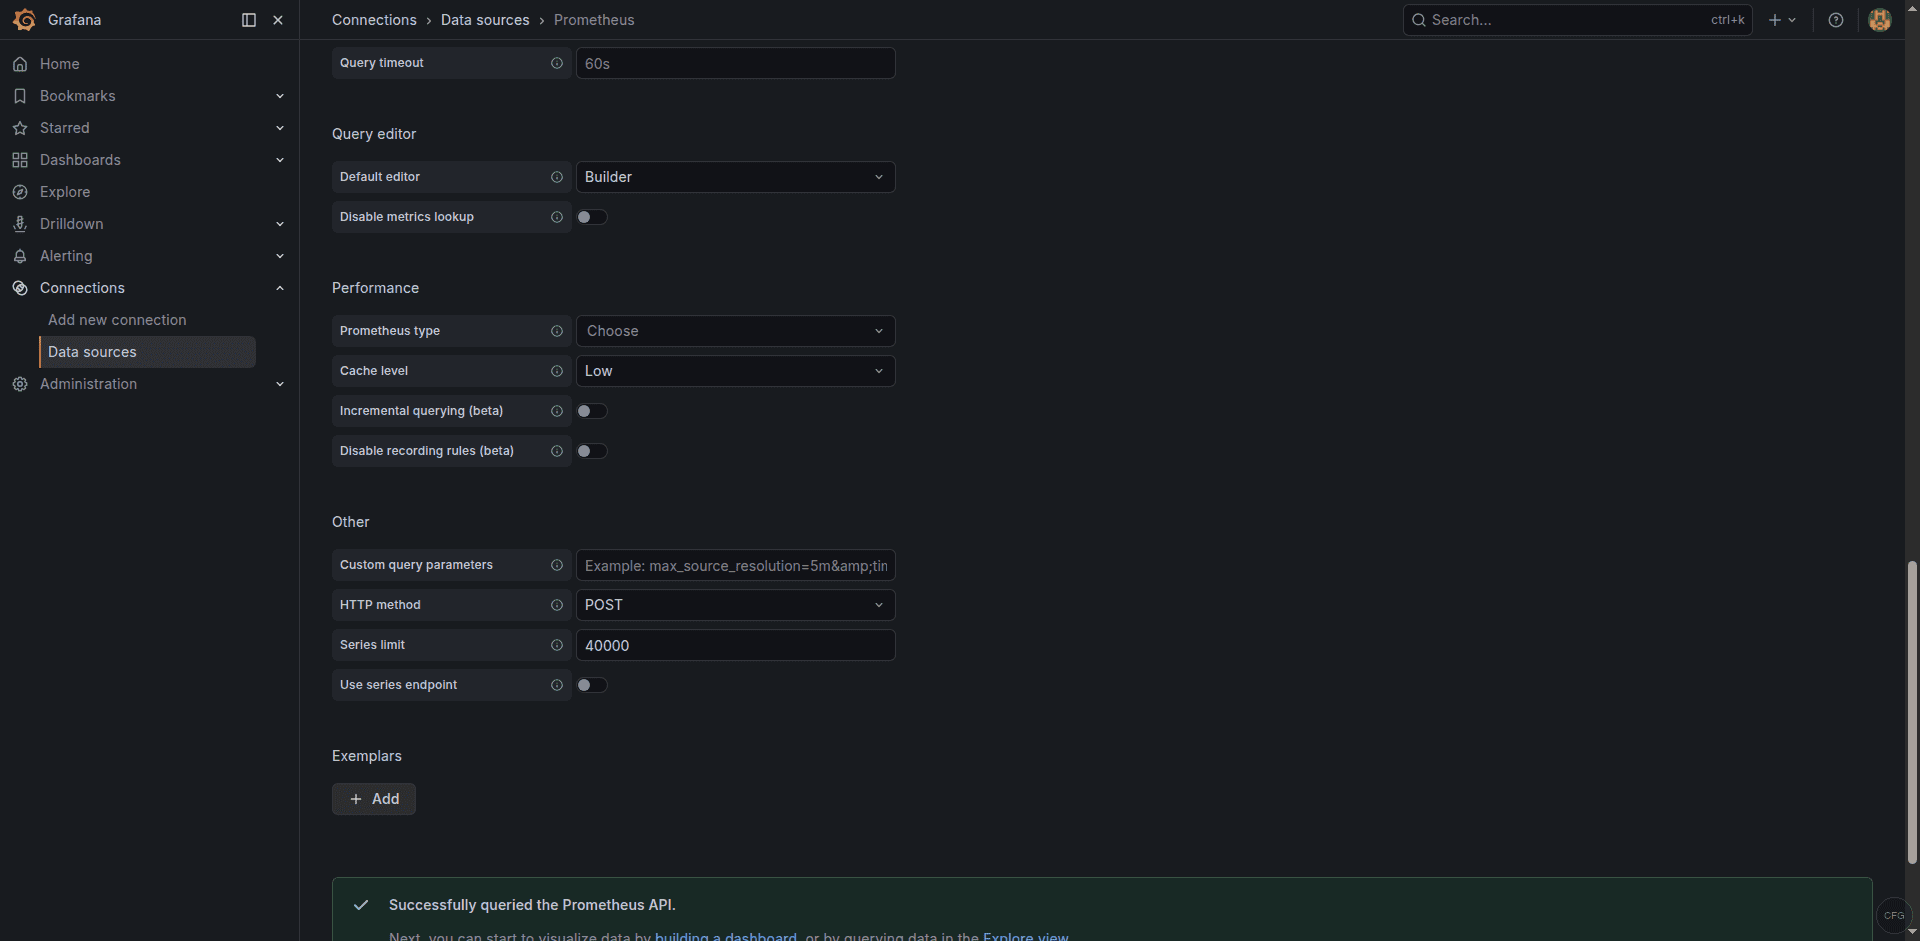
For remote Prometheus instances, replace localhost with the actual hostname or IP. If Prometheus uses basic auth or sits behind a reverse proxy, expand the Auth section and fill in the credentials.
Step 5: Import Community Dashboards
The fastest way to start visualizing metrics is to import a pre-built dashboard from the Grafana community library. Two dashboards that practically every Prometheus setup benefits from are Node Exporter Full (ID 1860) and the Docker Monitoring dashboard (ID 893).
To import a dashboard, go to Dashboards > New > Import. In the Import via grafana.com field, type the dashboard ID and click Load.
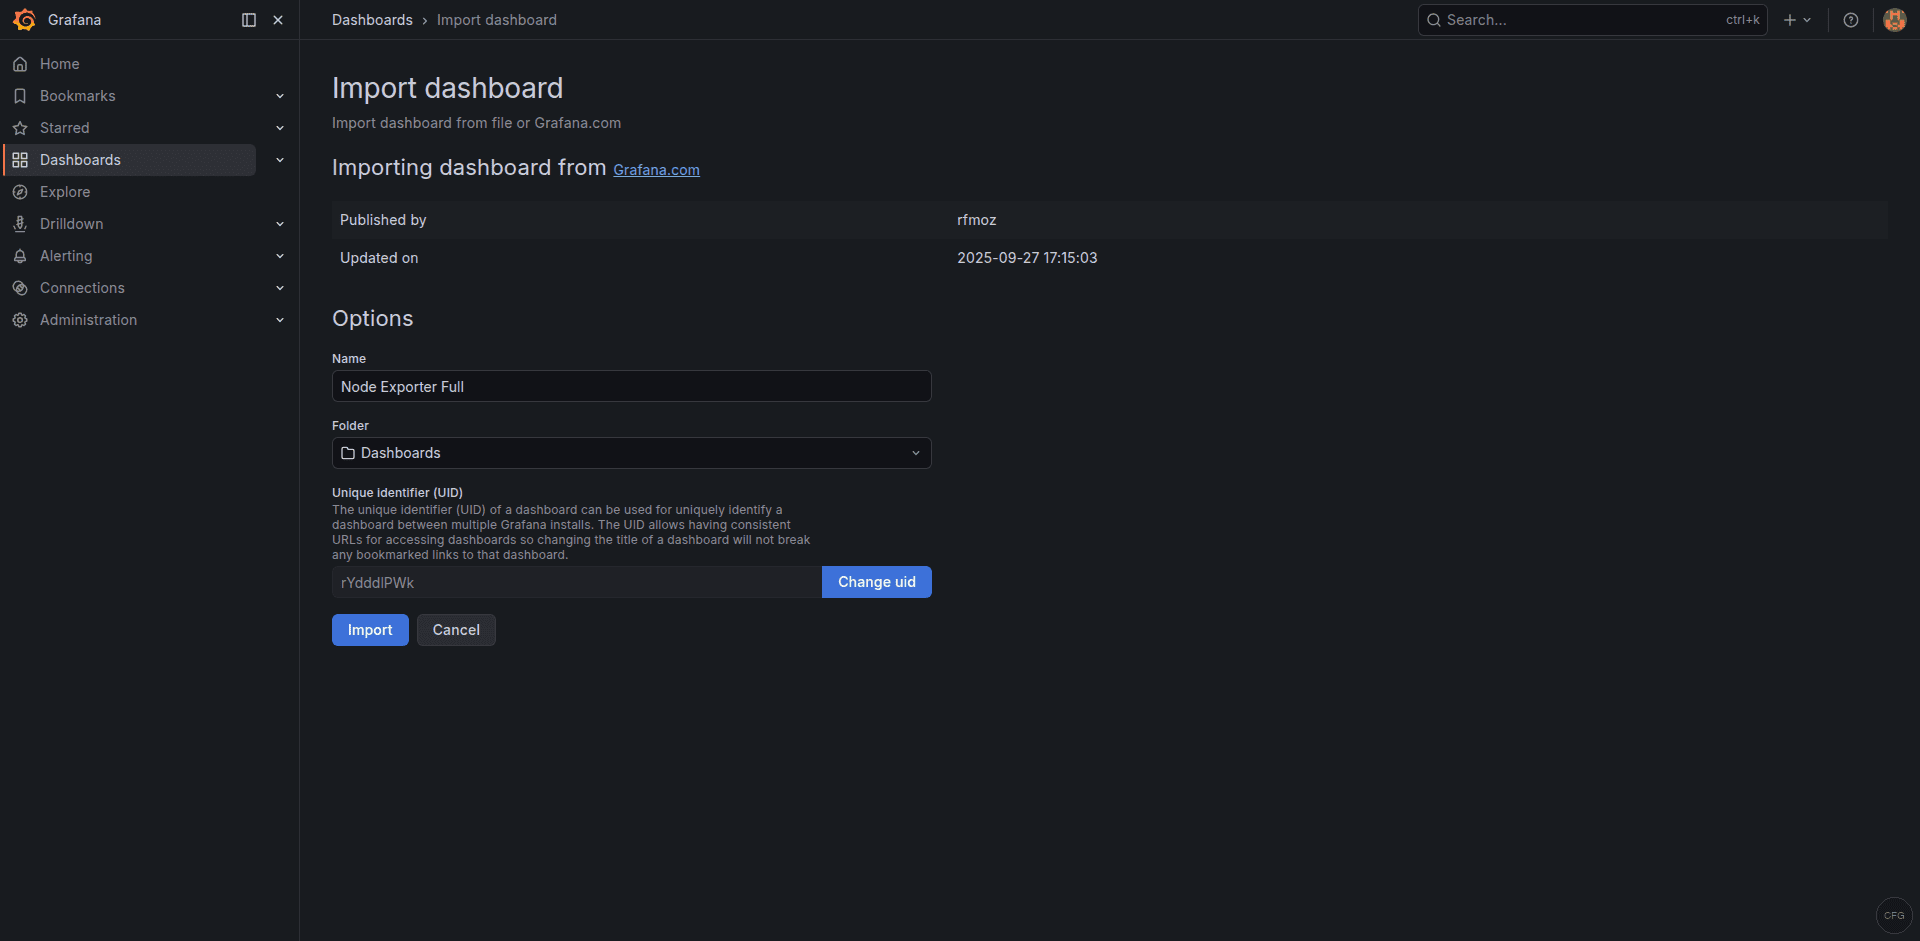
For example, enter 1860 and click Load. On the next screen, select your Prometheus data source from the dropdown, then click Import. Within seconds you will have dozens of panels showing CPU, memory, disk, and network metrics collected by Node Exporter.
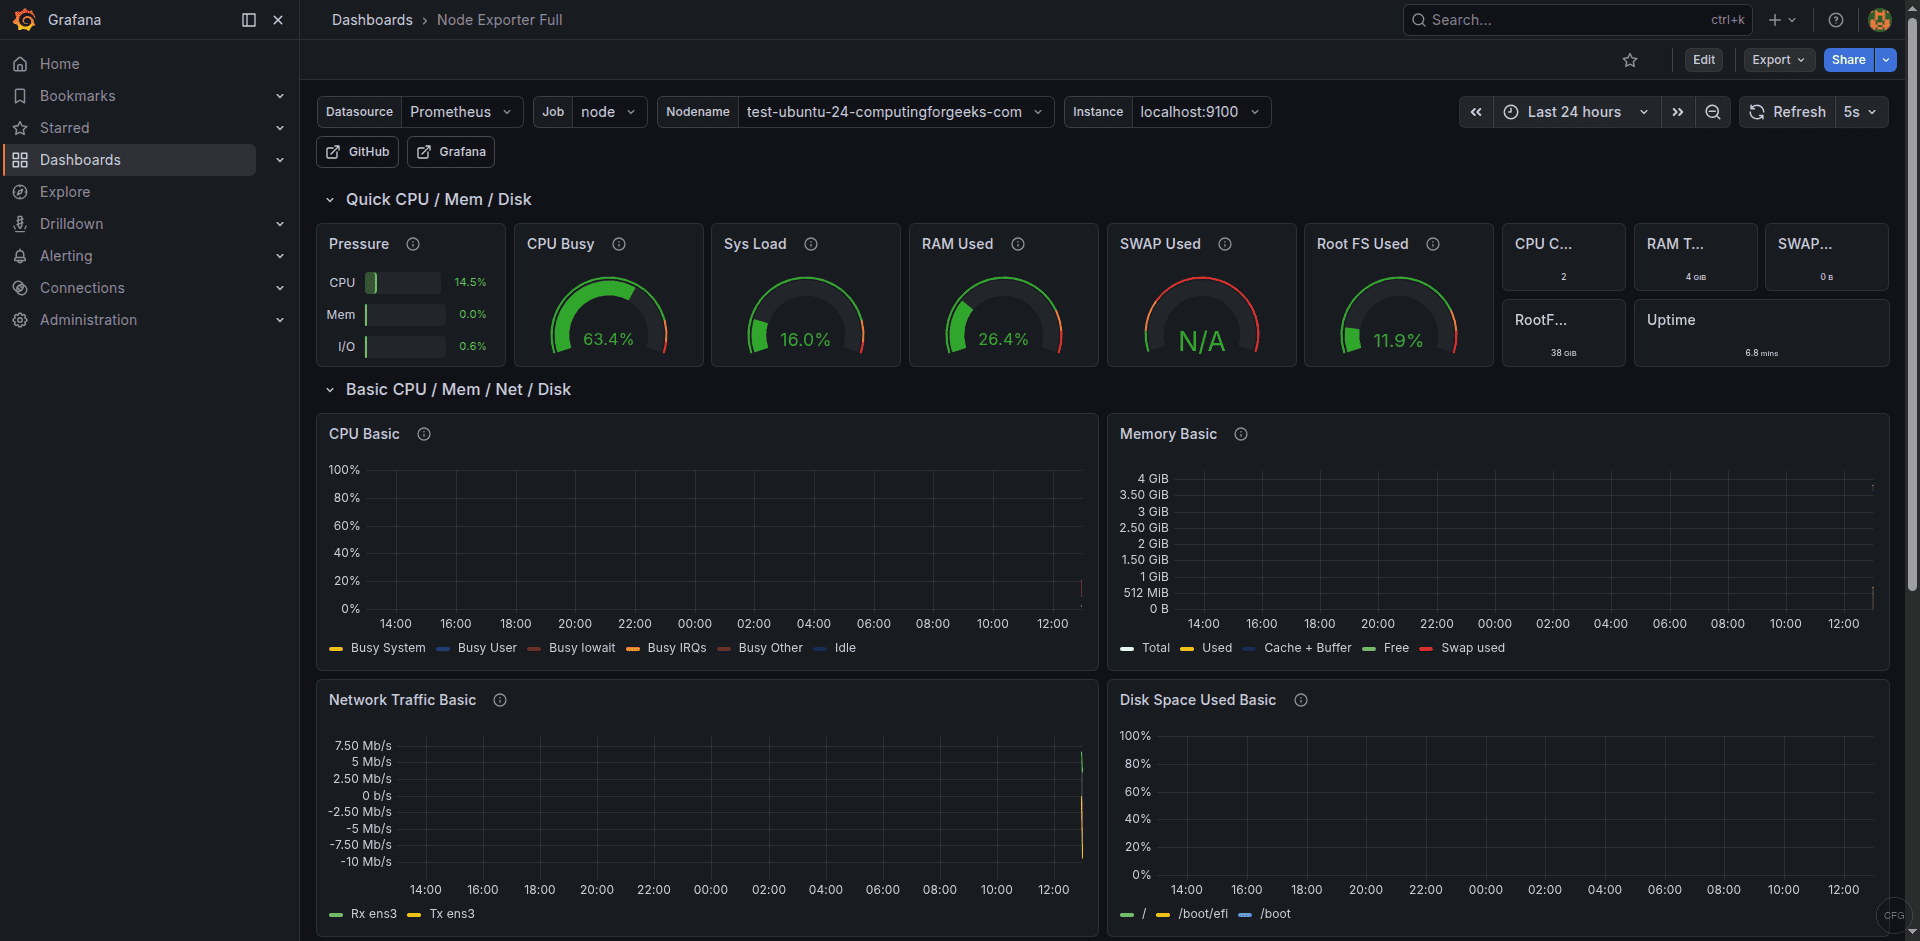
Repeat the same process with ID 893 if you run Docker workloads and have cAdvisor or Docker metrics exposed to Prometheus. These dashboards are fully editable, so you can rearrange panels, change thresholds, or add new queries as your monitoring needs grow.
Step 6: Create a Custom Dashboard with PromQL Panels
Imported dashboards are a great starting point, but production teams always end up building custom views tailored to their services. Here is how to create a dashboard from scratch.
Click Dashboards > New > New dashboard, then Add visualization. Select your Prometheus data source. In the query editor, switch to Code mode and enter a PromQL expression. A useful starting panel shows overall CPU usage across hosts:
100 - (avg by(instance) (irate(node_cpu_seconds_total{mode="idle"}[5m])) * 100)Set the panel title to “CPU Usage %” and pick the Time series visualization type. Click Apply to save the panel to the dashboard.
Add another panel for memory usage:
(1 - (node_memory_MemAvailable_bytes / node_memory_MemTotal_bytes)) * 100And a third panel for disk space on the root filesystem:
100 - ((node_filesystem_avail_bytes{mountpoint="/"} / node_filesystem_size_bytes{mountpoint="/"}) * 100)After adding your panels, click the floppy-disk icon at the top and give the dashboard a meaningful name. Use Dashboard settings > Variables to add a template variable for instance so users can filter panels by host from a dropdown at the top of the page.
Step 7: Configure Alerting
Grafana 11.x uses the Grafana Alerting engine by default. The older “legacy alerting” system that stored alert rules inside dashboard panels was removed in Grafana 10. All alerting is now centralized under the Alerting section in the sidebar.
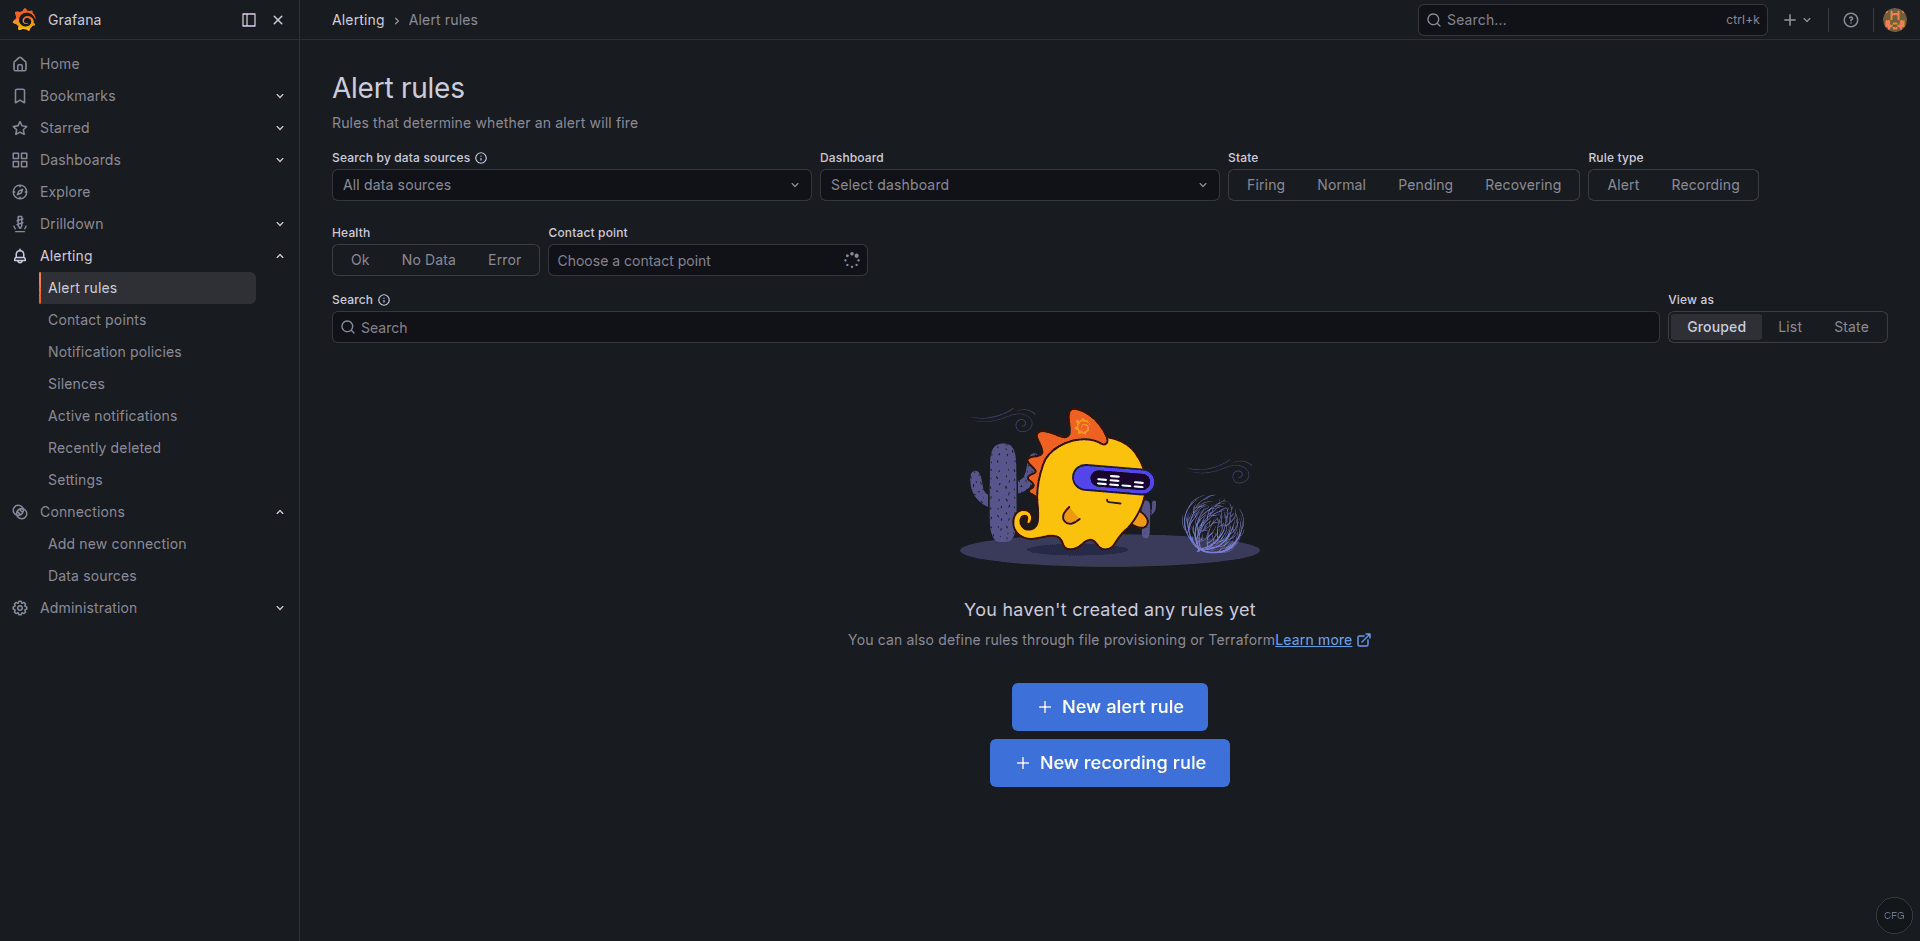
The alerting workflow has three parts:
- Contact points define where notifications go (email, Slack, PagerDuty, Opsgenie, webhooks, and more).
- Notification policies control routing, grouping, and timing of alerts.
- Alert rules contain the actual PromQL (or other query language) expressions and thresholds.
To create a basic alert, go to Alerting > Alert rules > New alert rule. Give it a name like “High CPU.” Set the query to:
100 - (avg by(instance) (irate(node_cpu_seconds_total{mode="idle"}[5m])) * 100)Under Expressions, add a Reduce expression that computes the Last value, then add a Threshold expression that fires when the value is above 90. Set the evaluation interval and the “for” duration (for example, evaluate every 1 minute and fire after 5 minutes of sustained breach). Assign the rule to a folder and an evaluation group, then save.
Before the alert can reach anyone, configure a contact point. Go to Alerting > Contact points > Add contact point. For Slack, choose the Slack integration type and paste your webhook URL. Save the contact point, then update the default notification policy to use it.
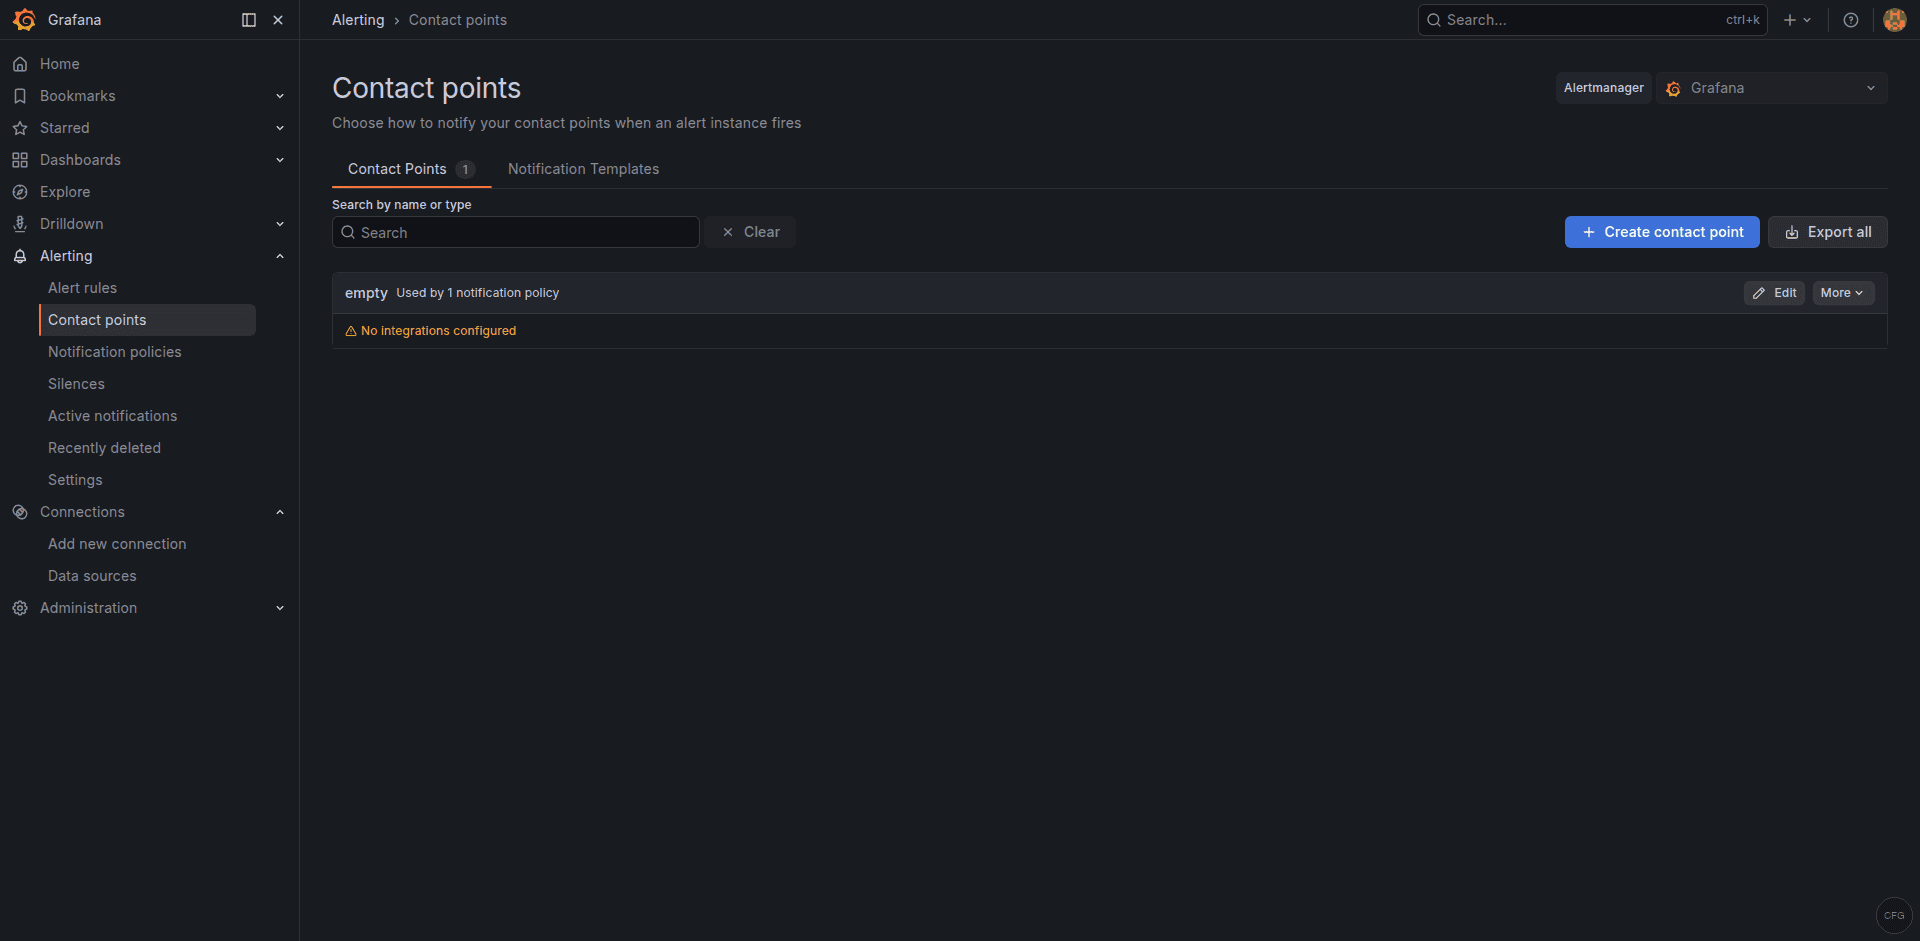
Test the full chain by temporarily lowering your threshold. Once you receive the notification, set the threshold back to a realistic value.
Step 8: Set Up Nginx Reverse Proxy with SSL
Running Grafana behind Nginx with TLS is the standard approach for production deployments. Start by installing Nginx and Certbot:
sudo apt install -y nginx certbot python3-certbot-nginxCreate an Nginx server block. Replace grafana.example.com with your actual domain:
sudo tee /etc/nginx/sites-available/grafana.conf <<'EOF'
server {
    listen 80;
    server_name grafana.example.com;

    location / {
        proxy_pass http://127.0.0.1:3000;
        proxy_set_header Host $host;
        proxy_set_header X-Real-IP $remote_addr;
        proxy_set_header X-Forwarded-For $proxy_add_x_forwarded_for;
        proxy_set_header X-Forwarded-Proto $scheme;
    }

    # WebSocket support for live features
    location /api/live/ {
        proxy_pass http://127.0.0.1:3000;
        proxy_http_version 1.1;
        proxy_set_header Upgrade $http_upgrade;
        proxy_set_header Connection "upgrade";
        proxy_set_header Host $host;
    }
}
EOF
Enable the site and test the configuration:
sudo ln -sf /etc/nginx/sites-available/grafana.conf /etc/nginx/sites-enabled/
sudo nginx -t && sudo systemctl reload nginx
Now obtain a free TLS certificate from Let’s Encrypt:
sudo certbot --nginx -d grafana.example.comCertbot will modify the server block to add the SSL directives and set up automatic renewal. After it finishes, update Grafana’s configuration so it knows it is behind a proxy. Edit /etc/grafana/grafana.ini and set these values under the [server] section:
[server]
domain = grafana.example.com
root_url = https://grafana.example.com/
protocol = http
Restart Grafana to apply the changes:
sudo systemctl restart grafana-serverYou can now access Grafana at https://grafana.example.com. If you want to prevent direct access on port 3000, bind Grafana only to localhost by adding http_addr = 127.0.0.1 under the [server] section and restarting.

Step 9: LDAP and OAuth Authentication
For teams larger than a handful of people, local Grafana accounts become hard to manage. Grafana 11.x supports LDAP, OAuth 2.0 (Google, GitHub, GitLab, Azure AD, Okta, and generic providers), and SAML (Enterprise only).
LDAP
Enable LDAP by editing /etc/grafana/grafana.ini:
[auth.ldap]
enabled = true
config_file = /etc/grafana/ldap.toml
allow_sign_up = true
Then edit /etc/grafana/ldap.toml. A minimal Active Directory configuration looks like this:
[[servers]]
host = "ldap.example.com"
port = 636
use_ssl = true
start_tls = false
ssl_skip_verify = false

bind_dn = "cn=grafana,ou=ServiceAccounts,dc=example,dc=com"
bind_password = "securepassword"

search_filter = "(sAMAccountName=%s)"
search_base_dns = ["dc=example,dc=com"]

[servers.attributes]
name = "givenName"
surname = "sn"
username = "sAMAccountName"
member_of = "memberOf"
email = "mail"

[[servers.group_mappings]]
group_dn = "cn=GrafanaAdmins,ou=Groups,dc=example,dc=com"
org_role = "Admin"

[[servers.group_mappings]]
group_dn = "cn=GrafanaEditors,ou=Groups,dc=example,dc=com"
org_role = "Editor"

[[servers.group_mappings]]
group_dn = "*"
org_role = "Viewer"
Restart Grafana after saving both files. Users will now be able to log in with their directory credentials, and their Grafana role will be assigned based on group membership.
OAuth (GitHub Example)
To configure GitHub OAuth, register a new OAuth application in your GitHub organization settings. Set the callback URL to https://grafana.example.com/login/github. Then add the following to /etc/grafana/grafana.ini:
[auth.github]
enabled = true
allow_sign_up = true
client_id = YOUR_CLIENT_ID
client_secret = YOUR_CLIENT_SECRET
scopes = user:email,read:org
auth_url = https://github.com/login/oauth/authorize
token_url = https://github.com/login/oauth/access_token
api_url = https://api.github.com/user
allowed_organizations = your-github-org
Restart Grafana. A “Sign in with GitHub” button will appear on the login page. For Google or Azure AD, the pattern is the same: register an OAuth app, note the client ID and secret, and fill in the corresponding [auth.google] or [auth.azuread] block in grafana.ini.
Step 10: Provisioning Dashboards and Data Sources via YAML
Clicking through the UI is fine when you manage one Grafana instance. When you manage five, or when your dashboards need to be version-controlled alongside your Terraform and Ansible code, provisioning through YAML files is the way to go.
Grafana reads provisioning configuration from /etc/grafana/provisioning/. There are subdirectories for datasources, dashboards, alerting, and notifiers.
Provisioning a Data Source
Create a YAML file for your Prometheus data source:
sudo tee /etc/grafana/provisioning/datasources/prometheus.yaml <<'EOF'
apiVersion: 1

datasources:
  - name: Prometheus
    type: prometheus
    access: proxy
    url: http://localhost:9090
    isDefault: true
    editable: false
EOF
Provisioning Dashboards
First, tell Grafana where to find dashboard JSON files:
sudo tee /etc/grafana/provisioning/dashboards/default.yaml <<'EOF'
apiVersion: 1

providers:
  - name: default
    orgId: 1
    folder: Provisioned
    type: file
    disableDeletion: false
    updateIntervalSeconds: 30
    options:
      path: /var/lib/grafana/dashboards
      foldersFromFilesStructure: true
EOF
Then place your exported dashboard JSON files in /var/lib/grafana/dashboards/. You can export any dashboard from the Grafana UI by opening it, clicking the share icon, selecting Export, and toggling Export for sharing externally. Save the JSON file, commit it to your Git repository, and deploy it to the provisioning path with your configuration management tool of choice.
Restart Grafana after adding or changing provisioning files:
sudo systemctl restart grafana-serverProvisioned dashboards display a small “provisioned” badge in the UI. Users can still modify them temporarily, but changes revert on the next restart unless the JSON source file is updated. This workflow pairs well with CI/CD pipelines where dashboard changes go through pull requests and code review before landing in production.
Step 11: Upgrade Grafana
Because you installed Grafana from the official APT repository, upgrading is straightforward. Always check the Grafana release notes before upgrading, especially for major version bumps where breaking changes are documented.
Back up the Grafana database and configuration first:
sudo cp /var/lib/grafana/grafana.db /var/lib/grafana/grafana.db.bak
sudo cp /etc/grafana/grafana.ini /etc/grafana/grafana.ini.bak
Then upgrade:
sudo apt update && sudo apt install --only-upgrade grafanaGrafana handles database migrations automatically on startup. After the upgrade, restart the service and confirm the new version:
sudo systemctl restart grafana-server
grafana-server -v
Verify that your dashboards, data sources, and alert rules are intact. If anything looks off, restore the backup files and roll back to the previous package version with sudo apt install grafana=<previous-version>.
Step 12: Troubleshooting
Here are the issues that come up most often after a fresh Grafana install.
Grafana fails to start
Check the journal for detailed error messages:
sudo journalctl -u grafana-server -fCommon culprits include syntax errors in grafana.ini, incorrect file permissions on /var/lib/grafana, or port 3000 already being used by another process.
Port 3000 is already in use
Find the process occupying the port:
sudo ss -tlnp | grep 3000Either stop the conflicting service or change Grafana’s port in grafana.ini under the [server] section by setting http_port = 3001 (or any free port).
Cannot connect to Prometheus data source
Verify that Prometheus is running and reachable from the Grafana server:
curl -s http://localhost:9090/api/v1/status/config | head -c 200If Prometheus runs on a different host, check firewall rules and make sure the URL in Grafana matches the actual Prometheus listen address. When Prometheus is behind a reverse proxy, use the proxy URL instead.
Dashboard shows “No data”
This usually means the metric names in the dashboard do not match what your Prometheus instance actually scrapes. Open the panel, click on the query, and run it directly in the Prometheus expression browser at http://localhost:9090/graph to confirm the metric exists. Pay attention to label names. Dashboards like Node Exporter Full assume specific job labels (usually job="node"), which must match your prometheus.yml scrape config.
Nginx returns 502 Bad Gateway
This means Nginx cannot reach Grafana’s backend. Confirm Grafana is running and listening on the expected address. If you configured http_addr = 127.0.0.1, make sure the proxy_pass directive in Nginx points to http://127.0.0.1:3000 and not http://localhost:3000 (which may resolve to an IPv6 address on some systems).
Permission denied errors on provisioning files
Grafana runs as the grafana user. Make sure all files under /etc/grafana/provisioning/ and /var/lib/grafana/dashboards/ are owned by that user:
sudo chown -R grafana:grafana /etc/grafana/provisioning/
sudo chown -R grafana:grafana /var/lib/grafana/dashboards/
LDAP login fails
Enable LDAP debug logging by adding ldap_debug = true under [log] in grafana.ini. Restart Grafana and attempt a login. The log output at /var/log/grafana/grafana.log will show the exact bind and search operations, making it straightforward to spot mismatched DNs, bad credentials, or connectivity problems.
Wrapping Up
You now have a fully functional Grafana 11.x installation on Ubuntu 24.04 or Debian 13, backed by Prometheus, secured with Nginx and TLS, and configured for team access through LDAP or OAuth. The provisioning setup means your dashboards and data sources live in version control alongside your infrastructure code, which is exactly where they belong.
From here, you might look into setting up Grafana Loki for log aggregation, building SLO dashboards using recording rules in Prometheus, or exploring Grafana’s Scenes framework for building interactive app-like dashboards. The monitoring stack you have built in this guide is a solid foundation that will scale with your infrastructure.
