This article will cover how to install Wazuh server on CentOS 8|RHEL 8|AlmaLinux 8. Wazuh server is a free, open-source security monitoring tool that uses Elastic stack (ELK) . It is used to monitor security events at an application and OS level. You can therefore be able to get information about threat detection, incident response and integrity monitoring. In this tutorial, we shall be deploy Wazuh on a single-node CentOS/RHEL/Rocky Linux host, with ELK installed on the same host.
You can use Wazuh for the following applications:
- Security analysis
- Log analysis
- Vulnerability detection
- Container security
- Cloud security
The steps below will guide us on how to setup Wazuh server on a CentOS 8|RHEL 8|AlmaLinux 8 instance. We’ll consider automatic and manual installation methods.
Hardware requirements
The minimum requirements for this type of deployment are:
- 4 GB of RAM
- 2 CPU cores
- A 64-bit operating system
The recommended are:
- 16 GB of RAM
- 8 CPU cores
Method 1: Unattended installation of Wazuh Server
The quickest installation method for Wazuh Server on CentOS 8|RHEL 8|AlmaLinux 8 is by using provided bash script. You’ll need to first download the script to your Linux machine.
cd ~/
curl -so wazuh-installation.sh https://packages.wazuh.com/resources/4.2/open-distro/unattended-installation/unattended-installation.sh
Once the script has been downloaded run it to install Wazuh Server on CentOS 8|RHEL 8|AlmaLinux 8:
sudo bash ./wazuh-installation.shThe automated installation process should begin immediately.
03/01/2022 07:21:43 INFO: Installing all necessary utilities for the installation...
03/01/2022 07:22:44 INFO: Done
03/01/2022 07:22:44 INFO: Adding the Wazuh repository...
03/01/2022 07:22:49 INFO: Done
03/01/2022 07:22:49 INFO: Installing the Wazuh manager...
03/01/2022 07:23:52 INFO: Done
03/01/2022 07:24:10 INFO: Wazuh-manager started
03/01/2022 07:24:10 INFO: Installing Open Distro for Elasticsearch...
03/01/2022 07:24:41 INFO: Done
03/01/2022 07:24:41 INFO: Configuring Elasticsearch...
03/01/2022 07:25:14 INFO: Configuration file found. Creating certificates...
03/01/2022 07:25:14 INFO: Creating the Elasticsearch certificates...
03/01/2022 07:25:14 INFO: Creating Wazuh server certificates...
03/01/2022 07:25:14 INFO: Creating Kibana certificate...
03/01/2022 07:25:14 INFO: Certificates creation finished. They can be found in ~/certs.
03/01/2022 07:25:14 INFO: Certificates created
03/01/2022 07:26:12 INFO: Elasticsearch started
03/01/2022 07:26:12 INFO: Initializing Elasticsearch...

03/01/2022 07:26:31 INFO: Done
03/01/2022 07:26:31 INFO: Installing Filebeat...
03/01/2022 07:26:57 INFO: Filebeat started
03/01/2022 07:26:57 INFO: Done
03/01/2022 07:26:57 INFO: Installing Open Distro for Kibana...
03/01/2022 07:28:17 INFO: Kibana started
03/01/2022 07:28:17 INFO: Done
03/01/2022 07:28:23 INFO: Generating random passwords
03/01/2022 07:28:23 INFO: Done
03/01/2022 07:28:23 INFO: Creating backup...
03/01/2022 07:28:37 INFO: Backup created
03/01/2022 07:28:37 INFO: Generating hashes
03/01/2022 07:28:43 INFO: Hashes generated
03/01/2022 07:28:44 INFO: Filebeat started
03/01/2022 07:28:44 INFO: Kibana started
03/01/2022 07:28:44 INFO: Loading changes...
Save login details printed after a successful installation of Wazuh Server on CentOS 8|RHEL 8|AlmaLinux 8.
03/01/2022 07:28:59 INFO: Done
The password for wazuh is Hhi7x3fbky53o3CUOqHrmmB_KYtrYPv2

The password for admin is essbe8HUvetLJIIiz8Dro7678KrJXq9L

The password for kibanaserver is pYrWmr_rp_9zwai6qIrVvbTVM0h0GFE1

The password for kibanaro is qf9yBeNk2jZmlf4jIIH0ju6EtsK7a7Sw

The password for logstash is ML1ORQzLFOhIfKzq28kbjMsaNs67Po0k

The password for readall is ByXXeu83_IDF4XonaGu_yKsHP98XCpKO

The password for snapshotrestore is CsMgHviug8DUJCqfWSe3yhc6_cKX0RXs

The password for wazuh_admin is kZ9t10NvDkursCQPPtYm1NkQRzoLjkYT

The password for wazuh_user is Zuc-cT34n1AD8I8Qd1AzfjAneytwwCdk

03/01/2022 07:28:59 INFO: Passwords changed. Remember to update the password in /etc/filebeat/filebeat.yml and /etc/kibana/kibana.yml if necessary and restart the services. More info: https://documentation.wazuh.com/current/user-manual/elasticsearch/elastic-tuning.html#change-users-password
03/01/2022 07:28:59 INFO: Checking the installation...
03/01/2022 07:29:00 INFO: Elasticsearch installation succeeded.
03/01/2022 07:29:00 INFO: Filebeat installation succeeded.
03/01/2022 07:29:00 INFO: Initializing Kibana (this may take a while)
.
03/01/2022 07:29:10 INFO: Installation finished
03/01/2022 07:29:10 INFO: You can access the web interface https://<kibana_ip>. The credentials are wazuh:Hhi7x3fbky53o3CUOqHrmmB_KYtrYPv2
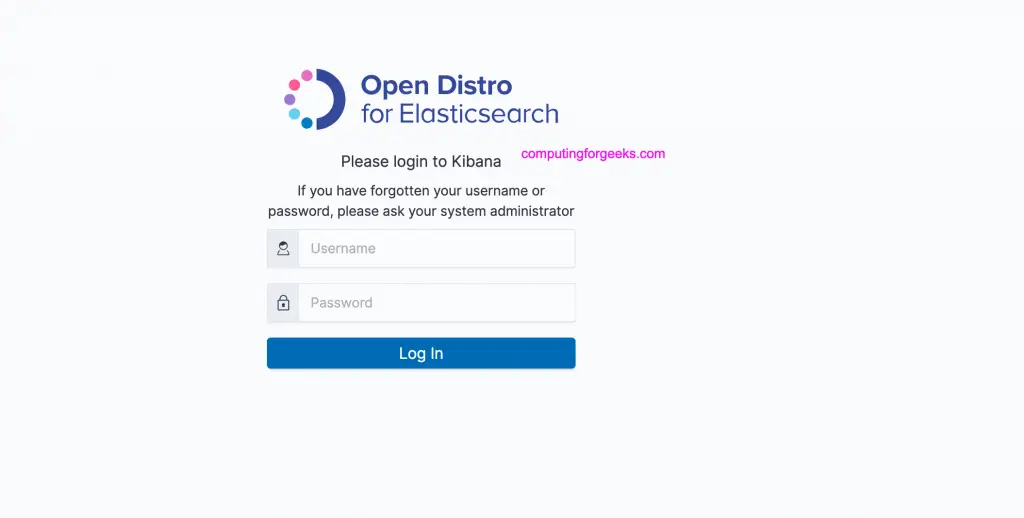
Access login portal at https://<serverip> and provide admin login details to authenticate.

Method 2: Manual installation of Wazuh Server
The second installation method we’ll consider is manual one. Where you perform all the actions by yourself.
Install Wazuh Server on CentOS 8|RHEL 8|AlmaLinux 8
Make sure your system is updated:
sudo dnf update -y
sudo dnf -y install vim curl unzip wget libcap
Add Wazuh GPG key
sudo rpm --import https://packages.wazuh.com/key/GPG-KEY-WAZUHAdd Wazuh repo
sudo tee /etc/yum.repos.d/wazuh.repo <<EOF
[wazuh]
gpgcheck=1
gpgkey=https://packages.wazuh.com/key/GPG-KEY-WAZUH
enabled=1
name=EL-Wazuh
baseurl=https://packages.wazuh.com/4.x/yum/
protect=1
EOF
Install Wazuh server:
sudo dnf -y install wazuh-managerRun Wazuh server
sudo systemctl enable --now wazuh-managerConfirm service status:
$ systemctl status wazuh-manager
● wazuh-manager.service - Wazuh manager
   Loaded: loaded (/usr/lib/systemd/system/wazuh-manager.service; enabled; vendor preset: disabled)
   Active: active (running) since Tue 2022-03-01 19:29:26 UTC; 2min 56s ago
  Process: 15660 ExecStart=/usr/bin/env /var/ossec/bin/wazuh-control start (code=exited, status=0/SUCCESS)
    Tasks: 117 (limit: 49281)
   Memory: 139.5M
   CGroup: /system.slice/wazuh-manager.service
           ├─15725 /var/ossec/framework/python/bin/python3 /var/ossec/api/scripts/wazuh-apid.py
           ├─15765 /var/ossec/bin/wazuh-authd
           ├─15782 /var/ossec/bin/wazuh-db
           ├─15806 /var/ossec/bin/wazuh-execd
           ├─15818 /var/ossec/bin/wazuh-analysisd
           ├─15880 /var/ossec/bin/wazuh-syscheckd
           ├─15893 /var/ossec/bin/wazuh-remoted
           ├─15926 /var/ossec/bin/wazuh-logcollector
           ├─15943 /var/ossec/bin/wazuh-monitord
           └─15953 /var/ossec/bin/wazuh-modulesd

Mar 01 19:29:22 centos.example.com env[15660]: 2022/03/01 19:29:22 wazuh-syscheckd: INFO: (6678): No directory provided for syscheck to monitor.
Mar 01 19:29:22 centos.example.com env[15660]: 2022/03/01 19:29:22 wazuh-syscheckd: INFO: (6001): File integrity monitoring disabled.
Mar 01 19:29:22 centos.example.com env[15660]: 2022/03/01 19:29:22 rootcheck: INFO: Rootcheck disabled.
Mar 01 19:29:22 centos.example.com env[15660]: Started wazuh-syscheckd...
Mar 01 19:29:23 centos.example.com env[15660]: Started wazuh-remoted...
Mar 01 19:29:23 centos.example.com env[15660]: Started wazuh-logcollector...
Mar 01 19:29:23 centos.example.com env[15660]: Started wazuh-monitord...
Mar 01 19:29:24 centos.example.com env[15660]: Started wazuh-modulesd...
Mar 01 19:29:26 centos.example.com env[15660]: Completed.
Mar 01 19:29:26 centos.example.com systemd[1]: Started Wazuh manager.
Install and Configure Elastic Stack
We will proceed to install ELK stack as part of Wazuh server setup. Elasticsearch, Filebeat and Kibana make up the ELK stack that is used for log analysis. These tools work in collaboration with Wazuh server to provide the security incident analysis and management.
Install and Configure Elasticsearch
Open Distro for Elasticsearch is an open source distribution of Elasticsearch, a highly scalable full-text search engine. It offers advanced security, alerting, index management, deep performance analysis, and several other additional features.
Run the following commands to install Open Distro for Elasticsearch.
sudo dnf -y install opendistroforelasticsearchDownload the configuration file for Elasticsearch:
wget https://packages.wazuh.com/resources/4.2/open-distro/elasticsearch/7.x/elasticsearch_all_in_one.yml
sudo mv elasticsearch_all_in_one.yml /etc/elasticsearch/elasticsearch.yml
Create users and roles required for the setup
for i in roles.yml roles_mapping.yml internal_users.yml; do
wget https://packages.wazuh.com/resources/4.2/open-distro/elasticsearch/roles/$i
sudo mv $i /usr/share/elasticsearch/plugins/opendistro_security/securityconfig/
done
Wazuh users added in Kibana by running the commands above are:
| wazuh_user | It is created for users who need read-only access to the Wazuh Kibana plugin. |
| wazuh_admin | It is recommended for users who need administrative privileges. |
Wazuh additional roles added in Kibana to give the appropriate permissions to users:
| wazuh_ui_user | It provides wazuh_user with permissions to read the Wazuh indices. |
| wazuh_ui_admin | It allows wazuh_admin to perform reading, writing, management, and indexing tasks on the Wazuh indices. |
Create SSL Certificates
Remove demo certificates generated during installation.
sudo rm -f /etc/elasticsearch/{esnode-key.pem,esnode.pem,kirk-key.pem,kirk.pem,root-ca.pem}Download the wazuh-cert-tool.sh script used to generate required certs
sudo su -
curl -so ~/wazuh-cert-tool.sh https://packages.wazuh.com/resources/4.2/open-distro/tools/certificate-utility/wazuh-cert-tool.sh
curl -so ~/instances.yml https://packages.wazuh.com/resources/4.2/open-distro/tools/certificate-utility/instances_aio.yml
Execute the script as root user to create the certificates required.
# bash ~/wazuh-cert-tool.sh
03/01/2022 20:55:51 INFO: Configuration file found. Creating certificates...
03/01/2022 20:55:51 INFO: Creating the Elasticsearch certificates...
03/01/2022 20:55:51 INFO: Creating Wazuh server certificates...
03/01/2022 20:55:52 INFO: Creating Kibana certificate...
03/01/2022 20:55:52 INFO: Certificates creation finished. They can be found in ~/certs.
Move the Elasticsearch certificates to their corresponding location:
mkdir /etc/elasticsearch/certs/
mv ~/certs/elasticsearch* /etc/elasticsearch/certs/
mv ~/certs/admin* /etc/elasticsearch/certs/
cp ~/certs/root-ca* /etc/elasticsearch/certs/
Run the commands below to mitigate Apache Log4j2 Remote Code Execution (RCE) vulnerability – CVE-2021-44228 – ESA-2021-31:
mkdir -p /etc/elasticsearch/jvm.options.d
echo '-Dlog4j2.formatMsgNoLookups=true' > /etc/elasticsearch/jvm.options.d/disabledlog4j.options
chmod 2750 /etc/elasticsearch/jvm.options.d/disabledlog4j.options
chown root:elasticsearch /etc/elasticsearch/jvm.options.d/disabledlog4j.options
Start elasticsearch service and enable to automatically come up on system boot.
sudo systemctl enable --now elasticsearchConfirm status to confirm it’s running:
$ systemctl status elasticsearch
● elasticsearch.service - Elasticsearch
   Loaded: loaded (/usr/lib/systemd/system/elasticsearch.service; enabled; vendor preset: disabled)
   Active: active (running) since Tue 2022-03-01 20:58:08 UTC; 1min 23s ago
     Docs: https://www.elastic.co
 Main PID: 16923 (java)
    Tasks: 50 (limit: 49281)
   Memory: 1.2G
   CGroup: /system.slice/elasticsearch.service
           └─16923 /usr/share/elasticsearch/jdk/bin/java -Xshare:auto -Des.networkaddress.cache.ttl=60 -Des.networkaddress.cache.negative.ttl=10 -XX:+AlwaysPreTouch -Xss1m -Djava.awt.headless=true >

Mar 01 20:57:51 centos.example.com systemd[1]: Starting Elasticsearch...
Mar 01 20:58:08 centos.example.com systemd[1]: Started Elasticsearch.
Run the Elasticsearch securityadmin script to load the new certificates information and start the cluster:
export JAVA_HOME=/usr/share/elasticsearch/jdk/ && /usr/share/elasticsearch/plugins/opendistro_security/tools/securityadmin.sh -cd /usr/share/elasticsearch/plugins/opendistro_security/securityconfig/ -nhnv -cacert /etc/elasticsearch/certs/root-ca.pem -cert /etc/elasticsearch/certs/admin.pem -key /etc/elasticsearch/certs/admin-key.pemValidate installation was successful
# curl -XGET https://localhost:9200 -u admin:admin -k
{
  "name" : "node-1",
  "cluster_name" : "elasticsearch",
  "cluster_uuid" : "n9h8pkMPTuW4r5R24YYdUg",
  "version" : {
    "number" : "7.10.2",
    "build_flavor" : "oss",
    "build_type" : "rpm",
    "build_hash" : "747e1cc71def077253878a59143c1f785afa92b9",
    "build_date" : "2021-01-13T00:42:12.435326Z",
    "build_snapshot" : false,
    "lucene_version" : "8.7.0",
    "minimum_wire_compatibility_version" : "6.8.0",
    "minimum_index_compatibility_version" : "6.0.0-beta1"
  },
  "tagline" : "You Know, for Search"
}
Install and Configure Kibana visualization tool
Instal Kibana by running the commands below in your terminal.
sudo dnf -y install opendistroforelasticsearch-kibanaDownload Kibana configuration
wget https://packages.wazuh.com/resources/4.2/open-distro/kibana/7.x/kibana_all_in_one.yml
sudo mv kibana_all_in_one.yml /etc/kibana/kibana.yml
Create Kibana data directory and set correct ownership permissions.
mkdir /usr/share/kibana/data
chown -R kibana:kibana /usr/share/kibana/data
Download Wazuh Kibana plugin
cd /usr/share/kibana
sudo -u kibana /usr/share/kibana/bin/kibana-plugin install https://packages.wazuh.com/4.x/ui/kibana/wazuh_kibana-4.2.5_7.10.2-1.zip
Installation output:
Transferring 33111704 bytes....................
Transfer complete
Retrieving metadata from plugin archive
Extracting plugin archive
Extraction complete
Plugin installation complete
Copy the Elasticsearch certificates into /etc/kibana/certs:
mkdir /etc/kibana/certs
cp ~/certs/root-ca.pem /etc/kibana/certs/
mv ~/certs/kibana* /etc/kibana/certs/
chown kibana:kibana /etc/kibana/certs/*
Link Kibana socket to privileged port 443:
setcap 'cap_net_bind_service=+ep' /usr/share/kibana/node/bin/nodeStart and enable kibana service:
systemctl daemon-reload
systemctl enable --now kibana
The service should now be in running state:
$ systemctl status kibana
● kibana.service - Kibana
   Loaded: loaded (/etc/systemd/system/kibana.service; enabled; vendor preset: disabled)
   Active: active (running) since Tue 2022-03-01 21:08:55 UTC; 7s ago
 Main PID: 17578 (node)
    Tasks: 11 (limit: 49281)
   Memory: 167.6M
   CGroup: /system.slice/kibana.service
           └─17578 /usr/share/kibana/bin/../node/bin/node /usr/share/kibana/bin/../src/cli/dist -c /etc/kibana/kibana.yml

Mar 01 21:08:55 centos.hirebestengineers.com systemd[1]: Started Kibana.
Access Kibana web console on:
URL: https://<wazuh_server_ip>
user: admin
password: admin
Install and Configure Filebeat
Filebeat is a log shipper that is used to ship logs to Easticsearch from the designated log directories.
sudo dnf install filebeat -yConfigure Flebeat to work with Wazuh. Backup the existing Filebeat configuration file then replace it with a downloaded pre-configured file.
wget https://packages.wazuh.com/resources/4.2/open-distro/filebeat/7.x/filebeat_all_in_one.yml
sudo mv filebeat_all_in_one.yml /etc/filebeat/filebeat.yml
Download the alerts template for Elasticsearch:
wget https://raw.githubusercontent.com/wazuh/wazuh/4.2/extensions/elasticsearch/7.x/wazuh-template.json
sudo mv wazuh-template.json /etc/filebeat/wazuh-template.json
sudo chmod go+r /etc/filebeat/wazuh-template.json
Download the Wazuh module for Filebeat:
curl -s https://packages.wazuh.com/4.x/filebeat/wazuh-filebeat-0.1.tar.gz | tar -xvz -C /usr/share/filebeat/moduleCopy the Elasticsearch certificates into /etc/filebeat/certs:
mkdir /etc/filebeat/certs
cp ~/certs/root-ca.pem /etc/filebeat/certs/
mv ~/certs/filebeat* /etc/filebeat/certs/
Enable and start the Filebeat service:
systemctl daemon-reload
systemctl enable --now filebeat
systemctl status filebeat
Confirm that filebeat is installed successfully.
# filebeat test output
elasticsearch: https://127.0.0.1:9200...
  parse url... OK
  connection...
    parse host... OK
    dns lookup... OK
    addresses: 127.0.0.1
    dial up... OK
  TLS...
    security: server's certificate chain verification is enabled
    handshake... OK
    TLS version: TLSv1.3
    dial up... OK
  talk to server... OK
  version: 7.10.2
Access Wazuh server web console on https://serverip_or_hostname

With this, you will be able to monitor your systems using Wazuh server by configuring agents on your client systems.
Check out these other interesting articles from this site:
